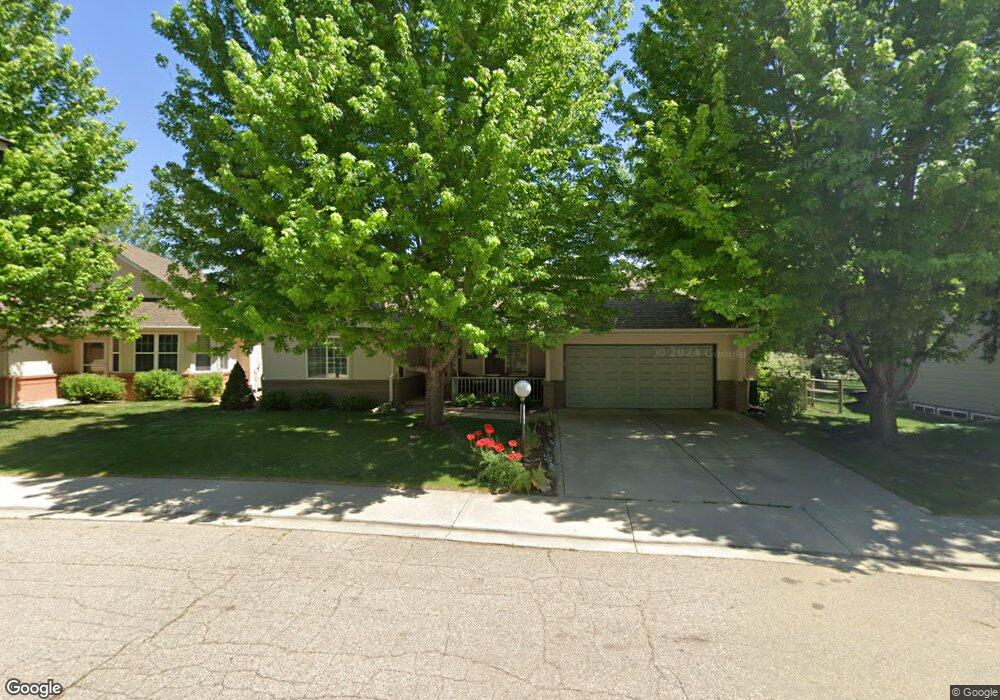
7072 Johnson Cir Niwot, CO 80503
Niwot NeighborhoodEstimated Value: $788,045 - $1,051,000
4
Beds
3
Baths
2,568
Sq Ft
$380/Sq Ft
Est. Value
About This Home
This home is located at 7072 Johnson Cir, Niwot, CO 80503 and is currently estimated at $976,761, approximately $380 per square foot. 7072 Johnson Cir is a home located in Boulder County with nearby schools including Niwot Elementary School, Sunset Middle School, and Niwot High School.
Ownership History
Date
Name
Owned For
Owner Type
Purchase Details
Closed on
Feb 28, 2002
Sold by
Root Nancy D
Bought by
Champion Ellen G
Current Estimated Value
Home Financials for this Owner
Home Financials are based on the most recent Mortgage that was taken out on this home.
Original Mortgage
$328,000
Outstanding Balance
$121,385
Interest Rate
6%
Mortgage Type
Purchase Money Mortgage
Estimated Equity
$855,376
Purchase Details
Closed on
Feb 14, 1999
Sold by
Hunt John J
Bought by
Root Nancy D
Home Financials for this Owner
Home Financials are based on the most recent Mortgage that was taken out on this home.
Original Mortgage
$240,000
Interest Rate
6.78%
Mortgage Type
Balloon
Purchase Details
Closed on
Mar 17, 1997
Sold by
Bowron Builders Inc
Bought by
Hunt John J
Home Financials for this Owner
Home Financials are based on the most recent Mortgage that was taken out on this home.
Original Mortgage
$221,500
Interest Rate
7.37%
Create a Home Valuation Report for This Property
The Home Valuation Report is an in-depth analysis detailing your home's value as well as a comparison with similar homes in the area
Home Values in the Area
Average Home Value in this Area
Purchase History
| Date | Buyer | Sale Price | Title Company |
|---|---|---|---|
| Champion Ellen G | $410,000 | First American Heritage Titl | |
| Root Nancy D | $317,900 | -- | |
| Hunt John J | $276,900 | -- |
Source: Public Records
Mortgage History
| Date | Status | Borrower | Loan Amount |
|---|---|---|---|
| Open | Champion Ellen G | $328,000 | |
| Previous Owner | Root Nancy D | $240,000 | |
| Previous Owner | Hunt John J | $221,500 | |
| Closed | Hunt John J | $27,650 |
Source: Public Records
Tax History
| Year | Tax Paid | Tax Assessment Tax Assessment Total Assessment is a certain percentage of the fair market value that is determined by local assessors to be the total taxable value of land and additions on the property. | Land | Improvement |
|---|---|---|---|---|
| 2025 | $5,758 | $63,363 | $16,269 | $47,094 |
| 2024 | $5,758 | $63,363 | $16,269 | $47,094 |
| 2023 | $5,683 | $64,836 | $15,062 | $53,459 |
| 2022 | $3,812 | $44,077 | $13,553 | $30,524 |
| 2021 | $3,863 | $45,346 | $13,943 | $31,403 |
| 2020 | $4,181 | $48,649 | $12,084 | $36,565 |
| 2019 | $4,115 | $48,649 | $12,084 | $36,565 |
| 2018 | $3,260 | $40,219 | $9,936 | $30,283 |
| 2017 | $3,069 | $44,465 | $10,985 | $33,480 |
| 2016 | $2,895 | $38,455 | $10,587 | $27,868 |
| 2015 | $2,758 | $34,355 | $8,119 | $26,236 |
| 2014 | $2,686 | $34,355 | $8,119 | $26,236 |
Source: Public Records
Map
Nearby Homes
- 8179 Dry Creek Cir
- 8403 Brittany Place
- 8060 Niwot Rd Unit 66E
- 8060 Niwot Rd Unit 58
- 8009 James Ct
- 8050 Niwot Rd Unit 28
- 8050 Niwot Rd Unit 1
- 6840 Cheney Ct
- 8568 Foxhaven Ct
- 8576 Niwot Meadow Farm Rd
- 386 Franklin St
- 7187 Longview Dr
- 6860 Goldbranch Dr
- 6851 Goldbranch Dr
- 7247 Longview Dr
- 6816 Goldbranch Dr
- 8528 Skyland Dr
- 8840 Niwot Rd
- 8836 Marathon Rd
- 6957 Peppertree Dr
- 7078 Johnson Cir
- 7066 Johnson Cir
- 7084 Johnson Cir
- 7069 Johnson Cir
- 7081 Johnson Cir
- 7060 Johnson Cir
- 7065 Johnson Cir
- 7090 Johnson Cir
- 7057 Johnson Cir
- 7096 Johnson Cir
- 7054 Johnson Cir
- 7103 Johnson Cir
- 7048 Johnson Cir
- 7107 Johnson Cir
- 7108 Johnson Cir
- 7033 Johnson Cir
- 7042 Johnson Cir
- 7111 Johnson Cir
- 7120 Johnson Cir
- 7098 Johnson Cir
Your Personal Tour Guide
Ask me questions while you tour the home.