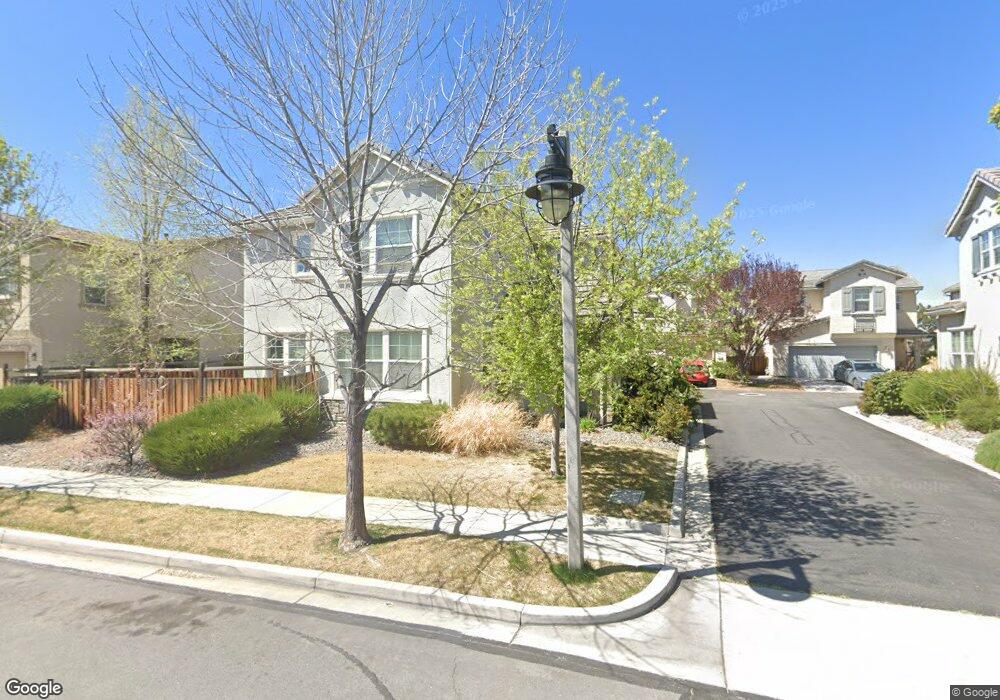
7075 Sacred Cir Sparks, NV 89436
Wingfield Springs NeighborhoodEstimated Value: $520,920 - $542,000
3
Beds
3
Baths
2,310
Sq Ft
$229/Sq Ft
Est. Value
About This Home
This home is located at 7075 Sacred Cir, Sparks, NV 89436 and is currently estimated at $528,980, approximately $228 per square foot. 7075 Sacred Cir is a home located in Washoe County with nearby schools including Dana Elementary School, Southern Elementary School, and Spanish Springs Elementary School.
Ownership History
Date
Name
Owned For
Owner Type
Purchase Details
Closed on
Feb 22, 2021
Sold by
Castillo Jenna and Silverwood Jenna
Bought by
Castillo Jenna Elizabeth and Castillo Family Living Trust
Current Estimated Value
Purchase Details
Closed on
May 27, 2020
Sold by
Silverwood Jenna
Bought by
Castillo Jenna and Silverwood Jenna
Home Financials for this Owner
Home Financials are based on the most recent Mortgage that was taken out on this home.
Original Mortgage
$208,500
Outstanding Balance
$177,565
Interest Rate
3.3%
Mortgage Type
New Conventional
Estimated Equity
$351,415
Purchase Details
Closed on
Jun 13, 2016
Sold by
Silverwood Tyrell A and Silverwood Jenna
Bought by
Silverwood Jenna
Purchase Details
Closed on
Oct 7, 2009
Sold by
D R Horton Inc Sacramento
Bought by
Silverwood Tyrell A and Castillo Jenna E
Home Financials for this Owner
Home Financials are based on the most recent Mortgage that was taken out on this home.
Original Mortgage
$186,410
Interest Rate
5%
Mortgage Type
FHA
Create a Home Valuation Report for This Property
The Home Valuation Report is an in-depth analysis detailing your home's value as well as a comparison with similar homes in the area
Home Values in the Area
Average Home Value in this Area
Purchase History
| Date | Buyer | Sale Price | Title Company |
|---|---|---|---|
| Castillo Jenna Elizabeth | -- | None Available | |
| Castillo Jenna | -- | Ticor Title Reno | |
| Silverwood Jenna | -- | Ticor Title | |
| Silverwood Tyrell A | $190,000 | Ticor Title Reno |
Source: Public Records
Mortgage History
| Date | Status | Borrower | Loan Amount |
|---|---|---|---|
| Open | Castillo Jenna | $208,500 | |
| Closed | Silverwood Tyrell A | $186,410 |
Source: Public Records
Tax History Compared to Growth
Tax History
| Year | Tax Paid | Tax Assessment Tax Assessment Total Assessment is a certain percentage of the fair market value that is determined by local assessors to be the total taxable value of land and additions on the property. | Land | Improvement |
|---|---|---|---|---|
| 2025 | $2,569 | $137,779 | $34,440 | $103,339 |
| 2024 | $2,569 | $132,658 | $28,805 | $103,853 |
| 2023 | $3,385 | $130,550 | $32,585 | $97,965 |
| 2022 | $2,422 | $108,781 | $27,475 | $81,306 |
| 2021 | $2,352 | $102,402 | $21,840 | $80,562 |
| 2020 | $2,282 | $101,542 | $20,965 | $80,577 |
| 2019 | $2,216 | $98,968 | $21,175 | $77,793 |
| 2018 | $2,151 | $90,933 | $15,085 | $75,848 |
| 2017 | $2,089 | $90,446 | $14,700 | $75,746 |
| 2016 | $2,036 | $88,654 | $12,705 | $75,949 |
| 2015 | $2,032 | $78,842 | $11,060 | $67,782 |
| 2014 | $1,973 | $65,927 | $9,905 | $56,022 |
| 2013 | -- | $52,856 | $7,000 | $45,856 |
Source: Public Records
Map
Nearby Homes
- 7003 Sacred Cir
- 3850 Artadi Dr
- 3684 Ancestor Cir
- 3723 Ancestor Cir
- 6636 N Latour
- 3644 Ancestor Cir
- 3706 Lepus Dr
- 6970 Rioja Ct
- 4033 Antinori Dr
- 3706 Deutz Dr
- 7045 Krug Dr
- 3660 Virgo Ct
- 2003 Forest Grove Ln
- 6726 Runnymede Dr
- 7422 Windswept Loop
- 6513 Citori Dr
- 7480 Windswept Loop
- 3991 White Oak Ln
- 6480 Citori Dr
- 7220 Windswept Loop
- 7077 Sacred Cir
- 7071 Sacred Cir
- 7079 Sacred Cir
- 7073 Sacred Cir
- 7069 Sacred Cir
- 7081 Sacred Cir
- 7083 Sacred Cir
- 7067 Sacred Cir
- 7087 Sacred Cir
- 7085 Sacred Cir
- 6810 Apus Dr
- 6820 Apus Dr
- 6830 Apus Dr
- 7089 Sacred Cir
- 7089 Sacred Cir
- 6800 Apus Dr
- 7070 Sacred Cir
- 7074 Sacred Cir
- 7065 Sacred Cir
- 6840 Apus Dr