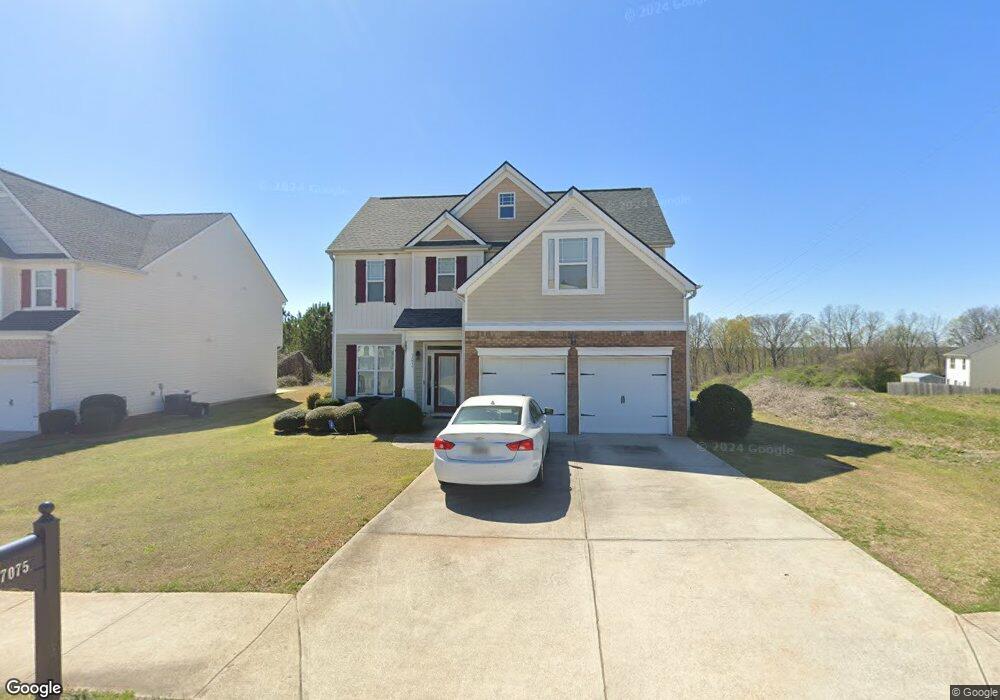
7075 Skippingstone Way Douglasville, GA 30134
Estimated Value: $255,000 - $300,000
3
Beds
3
Baths
1,614
Sq Ft
$168/Sq Ft
Est. Value
About This Home
This home is located at 7075 Skippingstone Way, Douglasville, GA 30134 and is currently estimated at $271,837, approximately $168 per square foot. 7075 Skippingstone Way is a home located in Douglas County with nearby schools including North Douglas Elementary School, Stewart Middle School, and Douglas County High School.
Ownership History
Date
Name
Owned For
Owner Type
Purchase Details
Closed on
Jan 28, 2009
Sold by
Homebanc Mtg Trust 2006-1
Bought by
Staten Kellie M
Current Estimated Value
Home Financials for this Owner
Home Financials are based on the most recent Mortgage that was taken out on this home.
Original Mortgage
$83,943
Outstanding Balance
$53,430
Interest Rate
5.23%
Mortgage Type
FHA
Estimated Equity
$218,407
Purchase Details
Closed on
May 6, 2008
Sold by
Jean-Baptiste Fritz and Jean-Baptiste Elisabeth
Bought by
Homebanc Mortgage Trust 2006-1
Purchase Details
Closed on
Jan 10, 2006
Sold by
Jean-Baptiste Fritz
Bought by
Jean-Baptiste Elisabeth
Home Financials for this Owner
Home Financials are based on the most recent Mortgage that was taken out on this home.
Original Mortgage
$129,050
Interest Rate
7%
Mortgage Type
New Conventional
Create a Home Valuation Report for This Property
The Home Valuation Report is an in-depth analysis detailing your home's value as well as a comparison with similar homes in the area
Home Values in the Area
Average Home Value in this Area
Purchase History
| Date | Buyer | Sale Price | Title Company |
|---|---|---|---|
| Staten Kellie M | $85,500 | -- | |
| Homebanc Mortgage Trust 2006-1 | $140,483 | -- | |
| Jean-Baptiste Elisabeth | -- | -- | |
| Jean-Baptiste Fritz | $181,400 | -- |
Source: Public Records
Mortgage History
| Date | Status | Borrower | Loan Amount |
|---|---|---|---|
| Open | Staten Kellie M | $83,943 | |
| Previous Owner | Jean-Baptiste Fritz | $129,050 | |
| Previous Owner | Jean-Baptiste Fritz | $16,165 |
Source: Public Records
Tax History Compared to Growth
Tax History
| Year | Tax Paid | Tax Assessment Tax Assessment Total Assessment is a certain percentage of the fair market value that is determined by local assessors to be the total taxable value of land and additions on the property. | Land | Improvement |
|---|---|---|---|---|
| 2024 | $3,057 | $91,960 | $20,000 | $71,960 |
| 2023 | $3,057 | $76,080 | $16,000 | $60,080 |
| 2022 | $2,489 | $76,080 | $16,000 | $60,080 |
| 2021 | $1,940 | $56,160 | $10,360 | $45,800 |
| 2020 | $1,984 | $56,160 | $10,360 | $45,800 |
| 2019 | $1,883 | $54,960 | $10,360 | $44,600 |
| 2018 | $1,824 | $52,480 | $10,120 | $42,360 |
| 2017 | $1,808 | $50,520 | $10,800 | $39,720 |
| 2016 | $1,643 | $45,040 | $8,000 | $37,040 |
| 2015 | $1,093 | $39,000 | $7,120 | $31,880 |
| 2014 | $1,093 | $29,360 | $5,200 | $24,160 |
| 2013 | -- | $26,280 | $5,200 | $21,080 |
Source: Public Records
Map
Nearby Homes
- 7095 Littlebrook Way
- 7099 Skippingstone Way
- 7125 Creeksong Dr
- 8072 Crystal Ln
- 7104 Skippingstone Way
- 8154 Brookbend Dr
- 7242 Westwood Ln
- 8005 Big Rock Dr
- 8553 Braylen Manor Dr
- 7130 Crystal Creek Place
- 7024 Branch Crossing Way
- 6859 John Clark Dr
- 6861 John Clark Dr
- 7475 Sydnee Ct
- 1568 Wembley Dr
- River Birch Plan at Oakhurst Manor
- Sequoia Plan at Oakhurst Manor
- Biltmore Plan at Oakhurst Manor
- 8370 Chicago Ave
- 7073 Skippingstone Way
- 7071 Skippingstone Way
- 7070 Skippingstone Way
- 7070 Skippingstone Way Unit 269
- 7074 Skippingstone Way
- 7101 Creeksong Dr Unit 55
- 7069 Skippingstone Way
- 7091 Creeksong Dr Unit 129
- 7091 Creeksong Dr
- 7103 Creeksong Dr Unit 56
- 7066 Skippingstone Way
- 7089 Creeksong Dr Unit 267
- 7089 Creeksong Dr
- 7080 Littlebrook Way Unit 34
- 7082 Littlebrook Way
- 7105 Creeksong Dr
- 7067 Skippingstone Way
- 7087 Creeksong Dr
- 7087 Creeksong Dr Unit 266
- 7078 Littlebrook Way