


7075 Starwood Dr Las Vegas, NV 89147
Estimated payment $2,196/month
Highlights
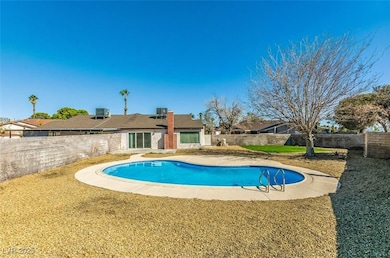
- In Ground Pool
- No HOA
- 1 Car Attached Garage
- Mountain View
- Cul-De-Sac
- 4-minute walk to Prosperity Park
About This Home
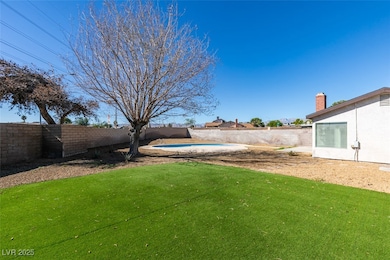
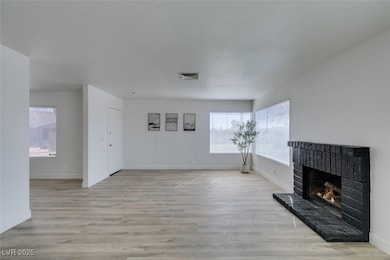
Incredible 1/4 Acre Yard with huge custom pool like no other, perfect for relaxing or entertaining. This modern home features luxury vinyl flooring, stylish tile bathrooms. Kitchen comes with stainless steel appliances included. Spacious 3 bedrooms, 2 bathrooms, plus versatile office space or convert it easily into a 4th bedroom. Priced to sell fast!
Townhouse Details
Home Type
- Townhome
Est. Annual Taxes
- $1,181
Year Built
- Built in 1979
Lot Details
- Cul-De-Sac
- East Facing Home
- Back Yard Fenced
- Brick Fence
- Desert Landscape
Parking
- 1 Car Attached Garage
Home Design
- Shingle Roof
- Composition Roof
Interior Spaces
- 1,519 Sq Ft Home
- 1-Story Property
- Ceiling Fan
- Wood Burning Fireplace
- Blinds
- Living Room with Fireplace
- Luxury Vinyl Plank Tile Flooring
- Mountain Views
Kitchen
- Gas Range
- Microwave
- Disposal
Bedrooms and Bathrooms
- 3 Bedrooms
Laundry
- Laundry on main level
- Gas Dryer Hookup
Accessible Home Design
- Handicap Accessible
Outdoor Features
- In Ground Pool
- Patio
Schools
- Diskin Elementary School
- Lawrence Middle School
- Spring Valley High School
Utilities
- Cooling System Powered By Gas
- Central Heating and Cooling System
- Heating System Uses Gas
Community Details
- No Home Owners Association
- Laurel Park Homes #2 Subdivision
Map
Home Values in the Area
Average Home Value in this Area
Tax History
| Year | Tax Paid | Tax Assessment Tax Assessment Total Assessment is a certain percentage of the fair market value that is determined by local assessors to be the total taxable value of land and additions on the property. | Land | Improvement |
|---|---|---|---|---|
| 2025 | $1,181 | $66,635 | $34,213 | $32,422 |
| 2024 | $1,069 | $66,635 | $34,213 | $32,422 |
| 2023 | $1,069 | $61,515 | $30,590 | $30,925 |
| 2022 | $1,038 | $54,441 | $24,553 | $29,888 |
| 2021 | $1,008 | $46,137 | $20,580 | $25,557 |
| 2020 | $975 | $46,723 | $19,845 | $26,878 |
| 2019 | $963 | $45,463 | $18,375 | $27,088 |
| 2018 | $919 | $42,942 | $16,538 | $26,404 |
| 2017 | $1,210 | $41,261 | $14,333 | $26,928 |
| 2016 | $862 | $35,718 | $7,718 | $28,000 |
| 2015 | $859 | $34,932 | $7,350 | $27,582 |
| 2014 | $834 | $30,098 | $5,950 | $24,148 |
Property History
| Date | Event | Price | List to Sale | Price per Sq Ft |
|---|---|---|---|---|
| 11/16/2025 11/16/25 | For Sale | $400,000 | 0.0% | $263 / Sq Ft |
| 11/12/2025 11/12/25 | Pending | -- | -- | -- |
| 10/29/2025 10/29/25 | For Sale | $400,000 | -- | $263 / Sq Ft |
Purchase History
| Date | Type | Sale Price | Title Company |
|---|---|---|---|
| Bargain Sale Deed | $297,000 | Chicago Title Of Nevada | |
| Bargain Sale Deed | $242,000 | Stewart Title Of Nevada | |
| Bargain Sale Deed | $145,000 | Fidelity National Title |
Mortgage History
| Date | Status | Loan Amount | Loan Type |
|---|---|---|---|
| Previous Owner | $193,600 | Unknown | |
| Previous Owner | $142,980 | FHA | |
| Closed | $48,400 | No Value Available |
Source: Las Vegas REALTORS®
MLS Number: 2731227
APN: 163-15-811-038
Disclaimer: Certain information contained herein is derived from information provided by parties other than Homes.com. All information provided is deemed reliable, but is not guaranteed to be accurate and should be independently verified.
![]() The data relating to real estate for sale on this web site comes in part from the INTERNET DATA EXCHANGE Program of the Greater Las Vegas Association of REALTORS® MLS. Real estate listings held by brokerage firms other than this site owner are marked with the IDX logo. Information is deemed reliable but not guaranteed. Copyright 2025 of the Greater Las Vegas Association of REALTORS® MLS. All rights reserved.
The data relating to real estate for sale on this web site comes in part from the INTERNET DATA EXCHANGE Program of the Greater Las Vegas Association of REALTORS® MLS. Real estate listings held by brokerage firms other than this site owner are marked with the IDX logo. Information is deemed reliable but not guaranteed. Copyright 2025 of the Greater Las Vegas Association of REALTORS® MLS. All rights reserved.
- 7012 Grassy Knoll St
- 7225 Bridgeview Ave
- 6969 Grassy Knoll St
- 7285 Bridgeview Ave
- 7247 Pleasant View Ave
- 7229 Pinebrook Cir
- 7274 Pinebrook Cir
- 7285 Pinebrook Cir
- 6990 Paddington Way
- 3974 Round Wood St
- 6824 Calella Dr
- 7400 W Flamingo Rd Unit 1033
- 7400 W Flamingo Rd Unit 2013
- 7400 W Flamingo Rd Unit 2056
- 7400 W Flamingo Rd Unit 1087
- 7130 Wedgewood Way
- 4352 Bramblewood St
- 6761 Bonillo Dr
- 6758 Calella Dr
- 6726 Oak Valley Dr
- 7019 Grassy Knoll St
- 4067 Arrowood Dr
- 7216 Archcrest Ave
- 7285 Bridgeview Ave
- 7301 Pleasant View Ave
- 6969 Paddington Way
- 4194 Greenpoint St
- 4341 Pineaire St
- 4197 Laurel Park Ave
- 3974 Round Wood St
- 7400 W Flamingo Rd Unit 2006
- 7400 W Flamingo Rd Unit 1056
- 7400 W Flamingo Rd Unit 2022
- 7425 Mountain Ash Dr
- 7018 Montcliff Ave
- 4398 Bramblewood St
- 4422 Bramblewood St
- 3737 Prosperity Ln
- 7312 Empress Dr
- 4406 Newhaven Dr
