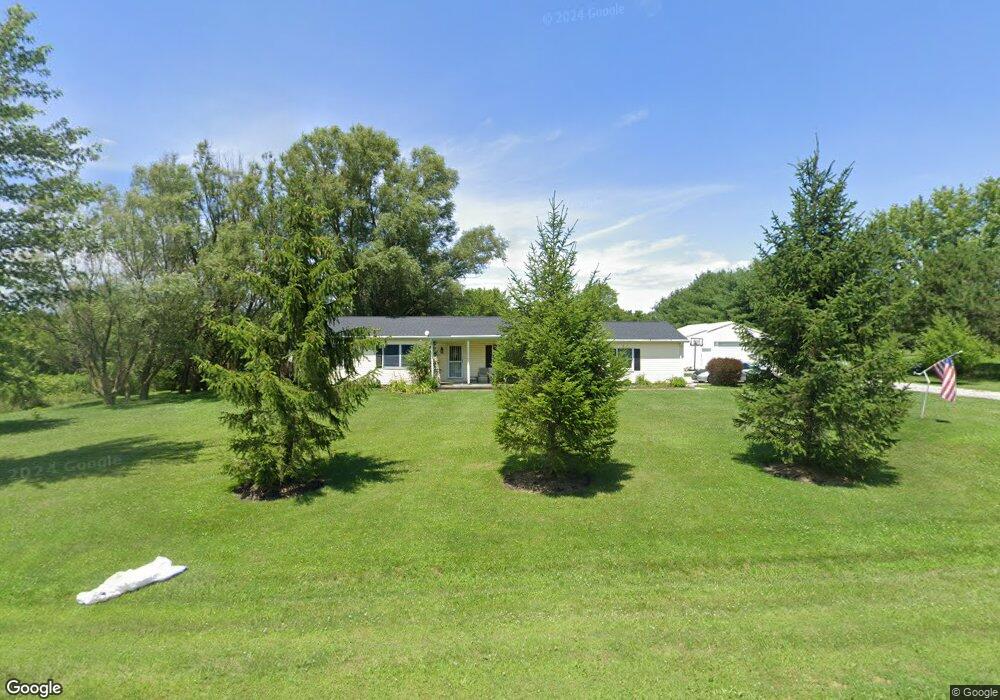
7075 W Ingle Rd Covington, OH 45318
Estimated Value: $274,000 - $312,000
3
Beds
3
Baths
1,404
Sq Ft
$204/Sq Ft
Est. Value
About This Home
This home is located at 7075 W Ingle Rd, Covington, OH 45318 and is currently estimated at $286,414, approximately $203 per square foot. 7075 W Ingle Rd is a home located in Miami County with nearby schools including Covington Elementary/Junior High School, Covington Junior High School, and Covington High School.
Ownership History
Date
Name
Owned For
Owner Type
Purchase Details
Closed on
May 13, 2016
Sold by
Millhouse Larry L and Estate Of Craig A Millhouse
Bought by
Collins Daniel A and Collins Leia J
Current Estimated Value
Home Financials for this Owner
Home Financials are based on the most recent Mortgage that was taken out on this home.
Original Mortgage
$155,269
Outstanding Balance
$123,282
Interest Rate
3.58%
Mortgage Type
New Conventional
Estimated Equity
$163,132
Purchase Details
Closed on
Mar 3, 2011
Sold by
Cornwell Bradford William and Cornwell Casey J
Bought by
Millhouse Craig A
Home Financials for this Owner
Home Financials are based on the most recent Mortgage that was taken out on this home.
Original Mortgage
$85,800
Interest Rate
4.78%
Mortgage Type
New Conventional
Purchase Details
Closed on
Feb 25, 2008
Sold by
Stacy Les and Stacy Cynthia R
Bought by
Cornwell Bradford William and Cornwell Casey J
Purchase Details
Closed on
May 22, 2007
Sold by
Darland Jerry J
Bought by
Stacy Les and Stacy Cynthia R
Create a Home Valuation Report for This Property
The Home Valuation Report is an in-depth analysis detailing your home's value as well as a comparison with similar homes in the area
Purchase History
| Date | Buyer | Sale Price | Title Company |
|---|---|---|---|
| Collins Daniel A | $150,000 | Attorney | |
| Millhouse Craig A | $139,900 | -- | |
| Cornwell Bradford William | $135,000 | -- | |
| Stacy Les | $125,000 | -- |
Source: Public Records
Mortgage History
| Date | Status | Borrower | Loan Amount |
|---|---|---|---|
| Open | Collins Daniel A | $155,269 | |
| Previous Owner | Stacy Les | $85,800 |
Source: Public Records
Tax History
| Year | Tax Paid | Tax Assessment Tax Assessment Total Assessment is a certain percentage of the fair market value that is determined by local assessors to be the total taxable value of land and additions on the property. | Land | Improvement |
|---|---|---|---|---|
| 2024 | $2,585 | $67,660 | $11,100 | $56,560 |
| 2023 | $2,330 | $67,660 | $11,100 | $56,560 |
| 2022 | $2,291 | $67,660 | $11,100 | $56,560 |
| 2021 | $1,887 | $52,050 | $8,540 | $43,510 |
| 2020 | $1,892 | $52,050 | $8,540 | $43,510 |
| 2019 | $1,886 | $52,050 | $8,540 | $43,510 |
| 2018 | $1,605 | $45,020 | $8,090 | $36,930 |
| 2017 | $1,637 | $45,020 | $8,090 | $36,930 |
| 2016 | $1,571 | $45,020 | $8,090 | $36,930 |
| 2015 | $1,489 | $42,460 | $7,630 | $34,830 |
| 2014 | $1,489 | $42,460 | $7,630 | $34,830 |
| 2013 | $1,498 | $42,460 | $7,630 | $34,830 |
Source: Public Records
Map
Nearby Homes
- 7550 N Crescent Rd
- 731 N Pearl St
- 698 E Broadway St
- 447 E Broadway St
- 7416 W Rike Rd
- 115 N Wenrick St
- 124 N Main St
- 223 Henry Ct
- 8040 N State Route 48
- 2 N Main St
- 111 S High St
- 221 S High St
- 415 S Wall St
- 212 Charles Ct
- 210 Charles Ct
- 206 Charles Ct
- 208 Charles Ct
- 204 Charles Ct
- 207 Charles Ct
- 205 Charles Ct
- 7055 W Ingle Rd
- 7125 W Ingle Rd
- 7044 W Ingle Rd
- 6754 N McMaken Rd
- 6710 N McMaken Rd
- 7185 W Ingle Rd
- 6655 N McMaken Rd
- 6920 N McMaken Rd
- 6582 N McMaken Rd
- 6791 N McMaken Rd
- 6825 N McMaken Rd
- 6882 N McMaken Rd
- 6564 N McMaken Rd
- 7227 W Ingle Rd
- 7010 N McMaken Rd
- 7070 N McMaken Rd
- 7100 N McMaken Rd
- 7095 N McMaken Rd
- 7290 W Perry Rd
- 7376 W Ingle Rd