Estimated Value: $276,000 - $515,000
5
Beds
8
Baths
2,728
Sq Ft
$149/Sq Ft
Est. Value
About This Home
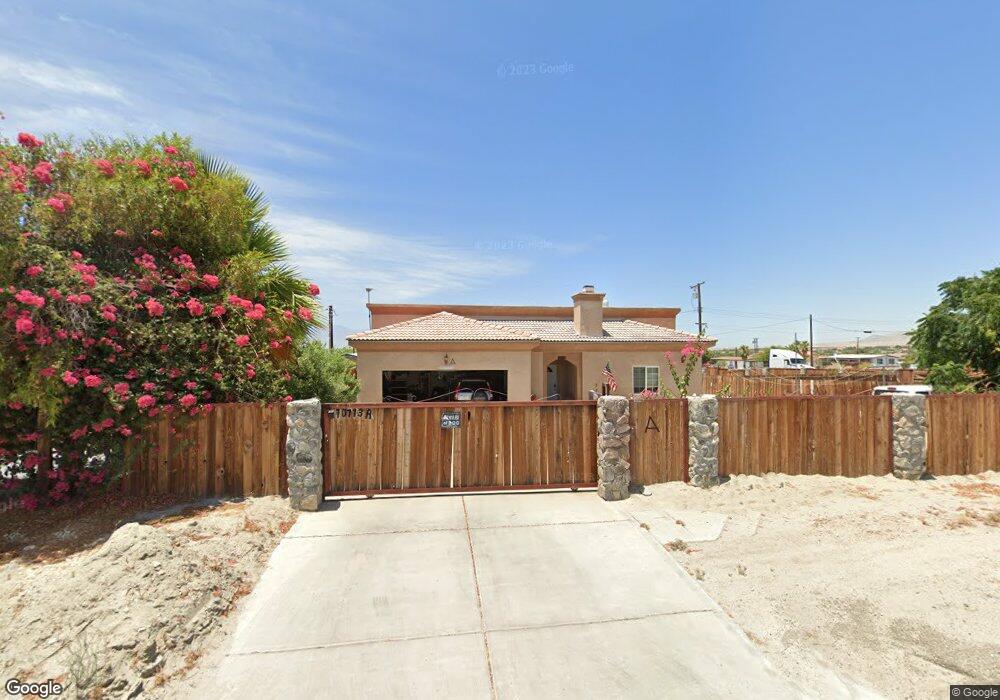
This home is located at 70773 Sea View Way, Mecca, CA 92254 and is currently estimated at $405,236, approximately $148 per square foot. 70773 Sea View Way is a home located in Riverside County with nearby schools including Saul Martinez Elementary School, Toro Canyon Middle School, and Desert Mirage High School.
Ownership History
Date
Name
Owned For
Owner Type
Purchase Details
Closed on
Mar 30, 2019
Sold by
Serna Antonia
Bought by
Serna Hecter Serna and Sea View Way Trust
Current Estimated Value
Purchase Details
Closed on
Jul 1, 2016
Sold by
Serna Antonia
Bought by
Serna Antonia and The Antonia Serna Living Trust
Purchase Details
Closed on
Oct 26, 2009
Sold by
Oros Felipe and Oros Dominga
Bought by
Serna Antonia
Purchase Details
Closed on
Jun 1, 2006
Sold by
Mendez Grace
Bought by
Oros Felipe and Oros Dominga
Purchase Details
Closed on
May 17, 2006
Sold by
Blair Freddy Marion and Burke Cinda Lou
Bought by
Mendez Grace
Purchase Details
Closed on
Feb 24, 2006
Sold by
Burke James J
Bought by
Burke Cinda Lou
Purchase Details
Closed on
Feb 8, 2006
Sold by
Mendez Jesus M
Bought by
Mendez Grace
Create a Home Valuation Report for This Property
The Home Valuation Report is an in-depth analysis detailing your home's value as well as a comparison with similar homes in the area
Home Values in the Area
Average Home Value in this Area
Purchase History
| Date | Buyer | Sale Price | Title Company |
|---|---|---|---|
| Serna Hecter Serna | -- | None Available | |
| Serna Antonia | -- | None Available | |
| Serna Antonia | -- | None Available | |
| Serna Antonia | $70,000 | None Available | |
| Oros Felipe | $10,000 | Chicago Title Company | |
| Mendez Grace | $28,000 | First American Title Co | |
| Burke Cinda Lou | -- | First American Title Co | |
| Mendez Grace | -- | First American Title Co |
Source: Public Records
Tax History Compared to Growth
Tax History
| Year | Tax Paid | Tax Assessment Tax Assessment Total Assessment is a certain percentage of the fair market value that is determined by local assessors to be the total taxable value of land and additions on the property. | Land | Improvement |
|---|---|---|---|---|
| 2025 | $1,785 | $141,970 | $25,807 | $116,163 |
| 2023 | $1,785 | $136,458 | $24,805 | $111,653 |
| 2022 | $1,742 | $133,783 | $24,319 | $109,464 |
| 2021 | $1,711 | $131,161 | $23,843 | $107,318 |
| 2020 | $1,692 | $129,817 | $23,599 | $106,218 |
| 2019 | $1,663 | $127,273 | $23,137 | $104,136 |
| 2018 | $1,631 | $124,779 | $22,684 | $102,095 |
| 2017 | $1,630 | $122,334 | $22,240 | $100,094 |
| 2016 | $1,562 | $119,936 | $21,804 | $98,132 |
| 2015 | $1,496 | $118,137 | $21,478 | $96,659 |
| 2014 | $1,490 | $115,824 | $21,058 | $94,766 |
Source: Public Records
Map
Nearby Homes
- 99380 Dolphin Dr
- 70535 Salton View Dr
- 0 Miramar Dr Unit SR25228566
- 0 Lookout Dr Unit 219129499DA
- Lot 352 Flamingo Dr
- Lot 351 Flamingo Dr
- Lot 350 Flamingo Dr
- 0000 Via Costa Brava & Vander Veer Rd
- 0 Coral Reef Rd Unit 219129389
- 0 NE Bay Dr Unit 219135676DA
- 0 Albatross Way Unit 219130240DA
- 0 Albatross Way Unit 219120048DA
- 00 72nd Ave
- 100080 72nd Ave
- 0 Avenue 70 Unit 219130294DA
- 69370 Beachcomber Dr
- Lot 339 Rocky Point Dr
- 72180 Barnacle Dr
- 0 Bounty Ave Unit 219122411DA
- 111 Marina Dr
- 70880 Harbor Dr
- 99490 Dolphin Dr
- 70905 Harbo Dr
- 70620 Harbor Dr
- 70945 Sea View Way
- 70645 Harbor Dr
- 11 Harbor Dr
- 70555 Harbor Dr Unit 64
- 70555 Harbor Dr
- Na Harbor Dr
- N-Shore Vacant Land - Harbor Dr
- 0 Vacant Land - Harbor Dr
- 70945 Harbor Dr
- 70670 Sea Gull Dr
- 70585 Harbor Dr
- 70585 Harbor Dr
- 0 Sea Gull Unit IV17133459
- 00 Sea Gull Dr
- 0- Sea Gull Dr
- Na Sea Gull Dr