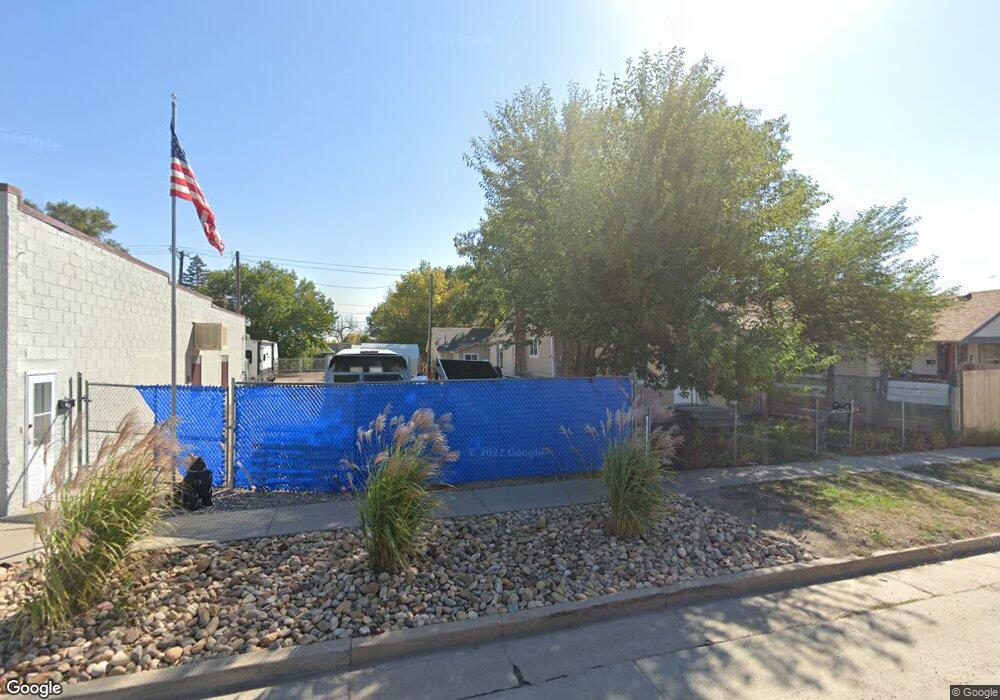
708 1/2 N 3rd St Sterling, CO 80751
Estimated Value: $74,000 - $147,086
1
Bed
1
Bath
589
Sq Ft
$183/Sq Ft
Est. Value
About This Home
This home is located at 708 1/2 N 3rd St, Sterling, CO 80751 and is currently estimated at $107,695, approximately $182 per square foot. 708 1/2 N 3rd St is a home located in Logan County with nearby schools including Campbell Elementary School, Ayres Elementary School, and Sterling Middle School.
Ownership History
Date
Name
Owned For
Owner Type
Purchase Details
Closed on
Apr 23, 2021
Sold by
Garcia Bruno
Bought by
Mec Investments Llc
Current Estimated Value
Home Financials for this Owner
Home Financials are based on the most recent Mortgage that was taken out on this home.
Original Mortgage
$76,704
Outstanding Balance
$69,254
Interest Rate
3%
Mortgage Type
Purchase Money Mortgage
Estimated Equity
$38,441
Purchase Details
Closed on
Jun 19, 2015
Sold by
Garcia Dora R
Bought by
Derojas Juana Castro
Purchase Details
Closed on
Dec 12, 2014
Sold by
Garcia Juana Castro and Dergas Juana Castro
Bought by
Garcia Dora R
Create a Home Valuation Report for This Property
The Home Valuation Report is an in-depth analysis detailing your home's value as well as a comparison with similar homes in the area
Home Values in the Area
Average Home Value in this Area
Purchase History
| Date | Buyer | Sale Price | Title Company |
|---|---|---|---|
| Mec Investments Llc | $55,000 | Stewart Title | |
| Derojas Juana Castro | -- | None Available | |
| Garcia Dora R | -- | None Available |
Source: Public Records
Mortgage History
| Date | Status | Borrower | Loan Amount |
|---|---|---|---|
| Open | Mec Investments Llc | $76,704 |
Source: Public Records
Tax History Compared to Growth
Tax History
| Year | Tax Paid | Tax Assessment Tax Assessment Total Assessment is a certain percentage of the fair market value that is determined by local assessors to be the total taxable value of land and additions on the property. | Land | Improvement |
|---|---|---|---|---|
| 2024 | $76 | $3,410 | $0 | $0 |
| 2023 | $76 | $3,410 | $0 | $0 |
| 2022 | $125 | $1,480 | $880 | $600 |
| 2021 | $125 | $1,560 | $930 | $630 |
| 2020 | $189 | $4,480 | $870 | $3,610 |
| 2019 | $188 | $4,440 | $860 | $3,580 |
| 2018 | $98 | $1,160 | $500 | $660 |
| 2017 | $97 | $5,640 | $2,420 | $3,220 |
| 2015 | $94 | $7,880 | $2,230 | $5,650 |
| 2014 | $94 | $9,480 | $2,230 | $7,250 |
| 2013 | $94 | $9,480 | $2,230 | $7,250 |
Source: Public Records
Map
Nearby Homes