Estimated Value: $1,656,021 - $2,057,000
3
Beds
2
Baths
1,729
Sq Ft
$1,033/Sq Ft
Est. Value
About This Home
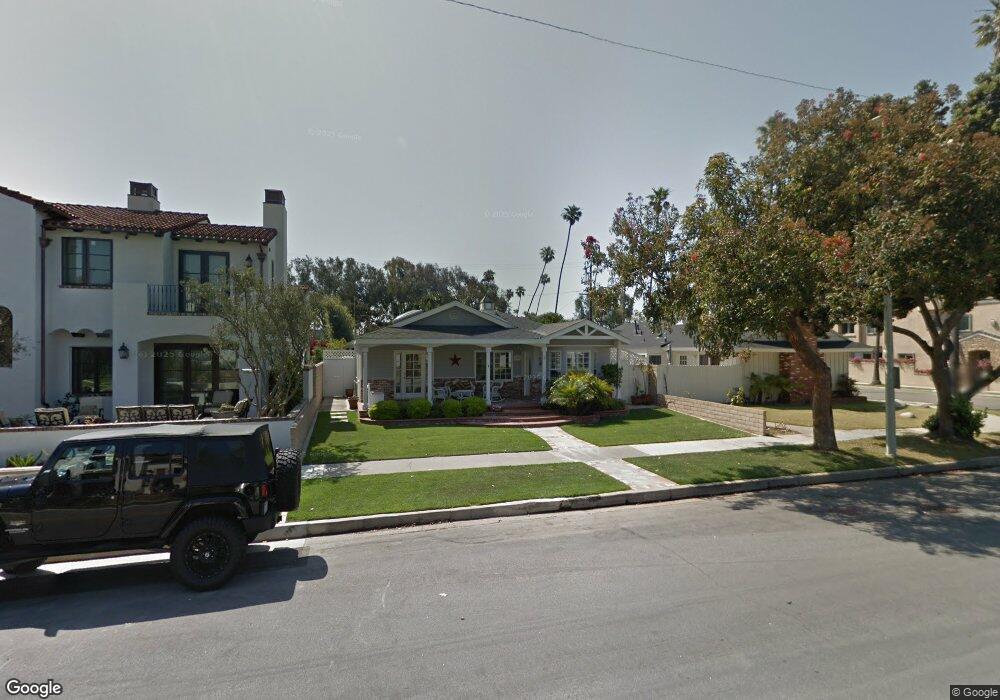
This home is located at 708 13th St, Huntington Beach, CA 92648 and is currently estimated at $1,785,505, approximately $1,032 per square foot. 708 13th St is a home located in Orange County with nearby schools including Agnes L. Smith Elementary, Ethel Dwyer Middle, and Huntington Beach High School.
Ownership History
Date
Name
Owned For
Owner Type
Purchase Details
Closed on
Feb 27, 2004
Sold by
Brown Stanley Curtis and Brown Colleen M
Bought by
Brown Stanley Curtis and Brown Colleen M
Current Estimated Value
Purchase Details
Closed on
Oct 25, 2002
Sold by
Brown Stanley Curtis and Brown Colleen M
Bought by
Brown Stanley Curtis and Brown Colleen M
Home Financials for this Owner
Home Financials are based on the most recent Mortgage that was taken out on this home.
Original Mortgage
$200,000
Interest Rate
5.88%
Purchase Details
Closed on
Sep 6, 1996
Sold by
Curtis Brown Stanley and Curtis Colleen M
Bought by
Brown Stanley Curtis and Brown Colleen M
Purchase Details
Closed on
Mar 18, 1993
Sold by
Brown Stanley Curtis
Bought by
Brown Stanley Curtis and Brown Colleen M
Home Financials for this Owner
Home Financials are based on the most recent Mortgage that was taken out on this home.
Original Mortgage
$155,000
Interest Rate
7.74%
Create a Home Valuation Report for This Property
The Home Valuation Report is an in-depth analysis detailing your home's value as well as a comparison with similar homes in the area
Home Values in the Area
Average Home Value in this Area
Purchase History
| Date | Buyer | Sale Price | Title Company |
|---|---|---|---|
| Brown Stanley Curtis | -- | -- | |
| Brown Stanley Curtis | -- | Fidelity National Title Co | |
| Brown Stanley Curtis | -- | -- | |
| Brown Stanley Curtis | -- | Gateway Title Company |
Source: Public Records
Mortgage History
| Date | Status | Borrower | Loan Amount |
|---|---|---|---|
| Closed | Brown Stanley Curtis | $200,000 | |
| Closed | Brown Stanley Curtis | $155,000 |
Source: Public Records
Tax History Compared to Growth
Tax History
| Year | Tax Paid | Tax Assessment Tax Assessment Total Assessment is a certain percentage of the fair market value that is determined by local assessors to be the total taxable value of land and additions on the property. | Land | Improvement |
|---|---|---|---|---|
| 2025 | $4,285 | $367,261 | $289,333 | $77,928 |
| 2024 | $4,285 | $360,060 | $283,660 | $76,400 |
| 2023 | $4,185 | $353,000 | $278,098 | $74,902 |
| 2022 | $4,073 | $346,079 | $272,645 | $73,434 |
| 2021 | $3,998 | $339,294 | $267,299 | $71,995 |
| 2020 | $3,970 | $335,815 | $264,558 | $71,257 |
| 2019 | $3,924 | $329,231 | $259,371 | $69,860 |
| 2018 | $3,863 | $322,776 | $254,285 | $68,491 |
| 2017 | $3,810 | $316,448 | $249,299 | $67,149 |
| 2016 | $3,646 | $310,244 | $244,411 | $65,833 |
| 2015 | $3,608 | $305,584 | $240,739 | $64,845 |
| 2014 | $3,532 | $299,599 | $236,024 | $63,575 |
Source: Public Records
Map
Nearby Homes