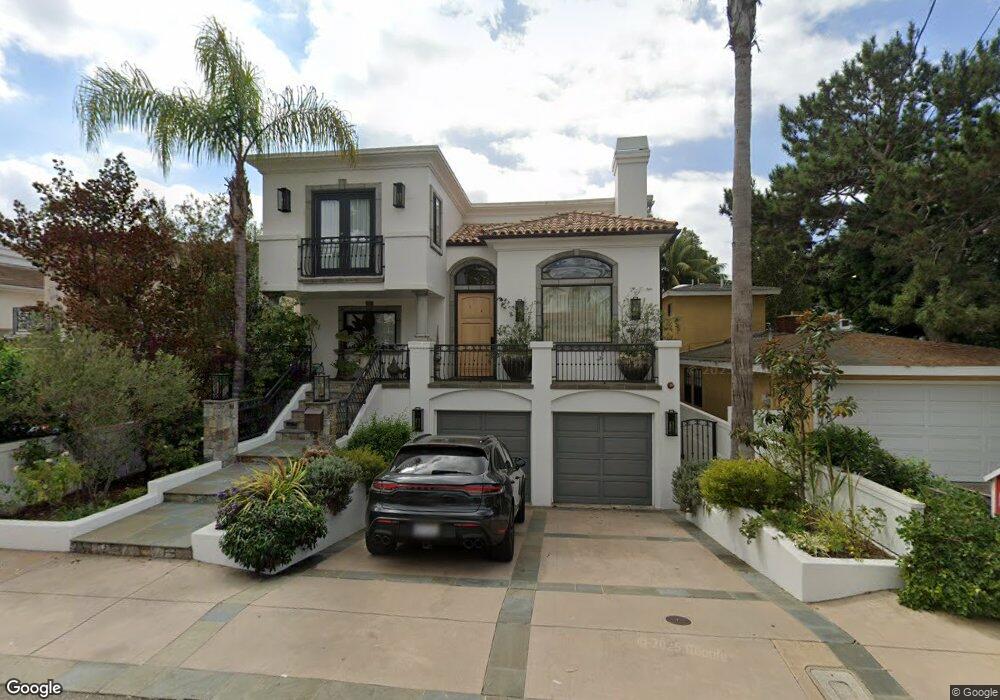
708 30th St Manhattan Beach, CA 90266
Estimated Value: $3,122,000 - $4,867,000
5
Beds
5
Baths
3,545
Sq Ft
$1,165/Sq Ft
Est. Value
About This Home
This home is located at 708 30th St, Manhattan Beach, CA 90266 and is currently estimated at $4,130,462, approximately $1,165 per square foot. 708 30th St is a home located in Los Angeles County with nearby schools including Grand View Elementary School, Manhattan Beach Middle School, and Mira Costa High School.
Ownership History
Date
Name
Owned For
Owner Type
Purchase Details
Closed on
Sep 5, 2012
Sold by
Cane Lawrence C
Bought by
Cane Lawrence C and Cane Tammy
Current Estimated Value
Home Financials for this Owner
Home Financials are based on the most recent Mortgage that was taken out on this home.
Original Mortgage
$1,031,489
Outstanding Balance
$698,425
Interest Rate
3.12%
Mortgage Type
New Conventional
Estimated Equity
$3,432,037
Purchase Details
Closed on
Nov 27, 2000
Sold by
Otting Joseph M
Bought by
Cane Lawrence C and Cane Tammy
Home Financials for this Owner
Home Financials are based on the most recent Mortgage that was taken out on this home.
Original Mortgage
$910,000
Interest Rate
7.13%
Purchase Details
Closed on
May 7, 1997
Sold by
Loiola Jose G
Bought by
Otting Joseph M and Otting Yvonne R
Home Financials for this Owner
Home Financials are based on the most recent Mortgage that was taken out on this home.
Original Mortgage
$333,850
Interest Rate
7.98%
Purchase Details
Closed on
Sep 20, 1994
Sold by
Adams John
Bought by
Loiola Jose G
Home Financials for this Owner
Home Financials are based on the most recent Mortgage that was taken out on this home.
Original Mortgage
$292,000
Interest Rate
8.7%
Create a Home Valuation Report for This Property
The Home Valuation Report is an in-depth analysis detailing your home's value as well as a comparison with similar homes in the area
Home Values in the Area
Average Home Value in this Area
Purchase History
| Date | Buyer | Sale Price | Title Company |
|---|---|---|---|
| Cane Lawrence C | -- | Chicago Title Company | |
| Cane Lawrence C | $1,300,000 | Investors Title Company | |
| Otting Joseph M | $420,000 | Title Land Company | |
| Loiola Jose G | $365,000 | Gateway Title Company |
Source: Public Records
Mortgage History
| Date | Status | Borrower | Loan Amount |
|---|---|---|---|
| Open | Cane Lawrence C | $1,031,489 | |
| Previous Owner | Cane Lawrence C | $910,000 | |
| Previous Owner | Otting Joseph M | $333,850 | |
| Previous Owner | Loiola Jose G | $292,000 | |
| Closed | Cane Lawrence C | $130,000 |
Source: Public Records
Tax History Compared to Growth
Tax History
| Year | Tax Paid | Tax Assessment Tax Assessment Total Assessment is a certain percentage of the fair market value that is determined by local assessors to be the total taxable value of land and additions on the property. | Land | Improvement |
|---|---|---|---|---|
| 2025 | $22,399 | $1,973,836 | $1,047,555 | $926,281 |
| 2024 | $22,399 | $1,935,134 | $1,027,015 | $908,119 |
| 2023 | $21,792 | $1,897,191 | $1,006,878 | $890,313 |
| 2022 | $21,418 | $1,859,992 | $987,136 | $872,856 |
| 2021 | $21,046 | $1,823,523 | $967,781 | $855,742 |
| 2019 | $20,484 | $1,769,438 | $939,077 | $830,361 |
| 2018 | $20,063 | $1,734,744 | $920,664 | $814,080 |
| 2016 | $18,620 | $1,667,383 | $884,914 | $782,469 |
| 2015 | $18,235 | $1,642,338 | $871,622 | $770,716 |
| 2014 | $17,981 | $1,610,168 | $854,549 | $755,619 |
Source: Public Records
Map
Nearby Homes
- 720 27th St
- 628 35th St
- 3308 Pacific Ave
- 2909 Maple Ave
- 0 N Memphis St
- 3616 Laurel Ave
- 3528 Pacific Ave
- 2904 Palm Ave
- 2104 Flournoy Rd
- 3212 N Poinsettia Ave
- 2001 Agnes Rd
- 460 30th St
- 3517 Walnut Ave
- 444 30th St
- 908 Rosecrans Ave
- 2208 Grandview Ave
- 532 Rosecrans Ave
- 425 30th St
- 436 32nd St
- 2100 Palm Ave