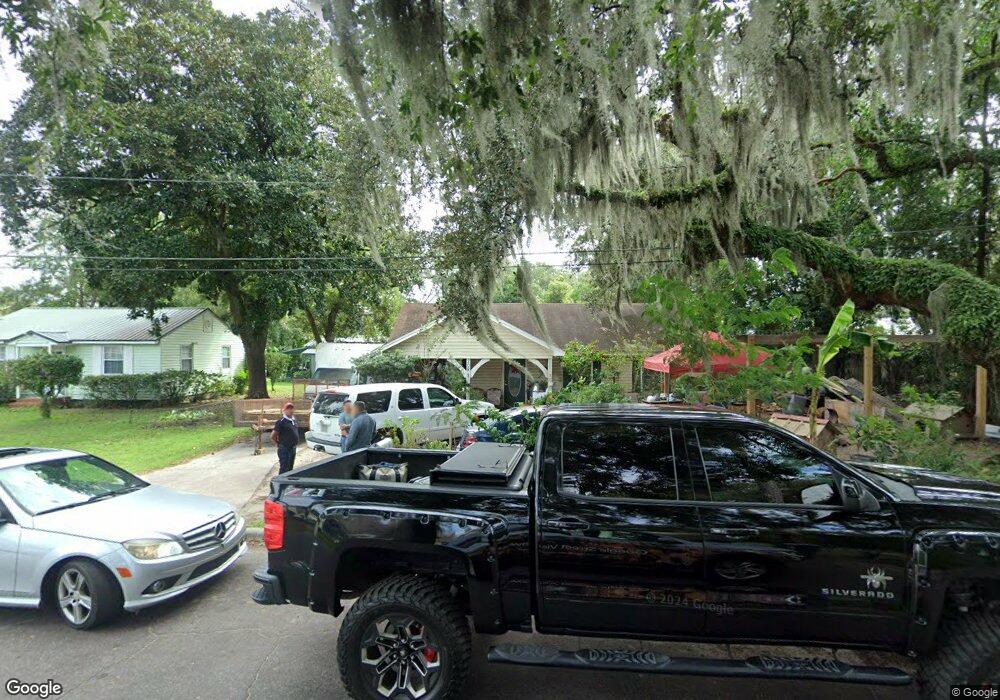
708 3rd St Brunswick, GA 31520
Estimated Value: $169,000 - $202,000
3
Beds
2
Baths
1,497
Sq Ft
$124/Sq Ft
Est. Value
About This Home
This home is located at 708 3rd St, Brunswick, GA 31520 and is currently estimated at $185,473, approximately $123 per square foot. 708 3rd St is a home located in Glynn County with nearby schools including Goodyear Elementary School, Risley Middle School, and Glynn Academy.
Ownership History
Date
Name
Owned For
Owner Type
Purchase Details
Closed on
Jan 31, 2019
Sold by
Wheatley Wilma Fay
Bought by
Martinez-Flores Jamie
Current Estimated Value
Home Financials for this Owner
Home Financials are based on the most recent Mortgage that was taken out on this home.
Original Mortgage
$60,000
Interest Rate
4.5%
Mortgage Type
New Conventional
Purchase Details
Closed on
Oct 23, 2008
Sold by
Lbw Land Llc
Bought by
Wheatly Herschel E and Wheatly Wilma Fay
Purchase Details
Closed on
May 15, 2008
Sold by
Lbw Land Llc
Bought by
Wheatly Herschele E and Wheatley Wilma Fay
Home Financials for this Owner
Home Financials are based on the most recent Mortgage that was taken out on this home.
Original Mortgage
$106,560
Interest Rate
5.86%
Mortgage Type
New Conventional
Purchase Details
Closed on
Aug 24, 2007
Sold by
Wheatly H E Reverend
Bought by
Lbw Land Llc
Create a Home Valuation Report for This Property
The Home Valuation Report is an in-depth analysis detailing your home's value as well as a comparison with similar homes in the area
Purchase History
| Date | Buyer | Sale Price | Title Company |
|---|---|---|---|
| Martinez-Flores Jamie | $80,000 | -- | |
| Wheatly Herschel E | -- | -- | |
| Wheatly Herschele E | -- | -- | |
| Lbw Land Llc | $35,000 | -- |
Source: Public Records
Mortgage History
| Date | Status | Borrower | Loan Amount |
|---|---|---|---|
| Closed | Martinez-Flores Jamie | $60,000 | |
| Previous Owner | Wheatly Herschele E | $106,560 | |
| Closed | Lbw Land Llc | $0 |
Source: Public Records
Tax History
| Year | Tax Paid | Tax Assessment Tax Assessment Total Assessment is a certain percentage of the fair market value that is determined by local assessors to be the total taxable value of land and additions on the property. | Land | Improvement |
|---|---|---|---|---|
| 2025 | $1,568 | $74,600 | $3,600 | $71,000 |
| 2024 | $1,177 | $56,000 | $3,600 | $52,400 |
| 2023 | $1,795 | $42,280 | $3,600 | $38,680 |
| 2022 | $1,808 | $42,280 | $3,600 | $38,680 |
| 2021 | $1,313 | $28,360 | $3,600 | $24,760 |
| 2020 | $1,325 | $28,360 | $3,600 | $24,760 |
| 2019 | $467 | $21,040 | $3,600 | $17,440 |
| 2018 | $637 | $26,520 | $3,600 | $22,920 |
| 2017 | $1,245 | $26,520 | $3,600 | $22,920 |
| 2016 | $961 | $21,720 | $3,600 | $18,120 |
| 2015 | $974 | $21,720 | $3,600 | $18,120 |
| 2014 | $974 | $21,440 | $3,600 | $17,840 |
Source: Public Records
Map
Nearby Homes
- 712 3rd St
- 3228 Treville Ave
- 708 Treville Cir
- 802 3rd St
- 3222 Treville Ave
- 3301 Hardee Ave
- 707 Treville Cir
- 3218 Treville Ave
- 3302 Treville Ave
- 806 3rd St
- 3219 Treville Ave
- 3308 Treville Ave
- 3302 Hardee Ave
- 3208 Treville Ave
- 3301 Treville Ave
- 3227 Treville Ave
- 3223 Treville Ave
- 3225 Norwich St
- 3308 Hardee Ave
- 711 2nd St