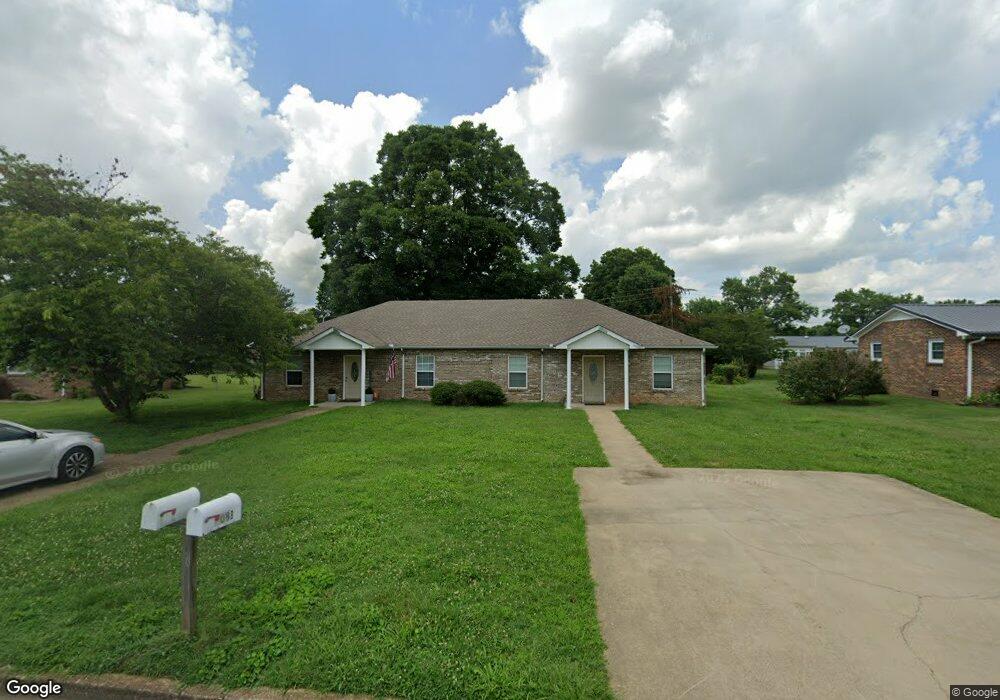
708 3rd St Lawrenceburg, TN 38464
Estimated Value: $178,000 - $279,846
Studio
2
Baths
2,176
Sq Ft
$107/Sq Ft
Est. Value
About This Home
This home is located at 708 3rd St, Lawrenceburg, TN 38464 and is currently estimated at $233,462, approximately $107 per square foot. 708 3rd St is a home with nearby schools including Ingram Sowell Elementary School, Lawrenceburg Public Elementary School, and David Crockett Elementary School.
Ownership History
Date
Name
Owned For
Owner Type
Purchase Details
Closed on
Jan 19, 2022
Sold by
Reichert Greg and Reichert Gregory L
Bought by
Reichert Gregory L and Reichert Rlt Gregory L
Current Estimated Value
Purchase Details
Closed on
Sep 27, 2015
Sold by
Hamby Kenny and Hamby Lee
Bought by
Josh Duke and Reichert Greg
Purchase Details
Closed on
Aug 14, 2009
Sold by
Kerstiens Construction Inc
Bought by
Hamby Kenny
Purchase Details
Closed on
Jun 21, 2007
Sold by
Kollefrath James A
Bought by
Kerstiens Construction Inc
Purchase Details
Closed on
Dec 17, 2003
Sold by
Kollefrath and Imog
Bought by
Revocabl Kollefrath James A Jr
Purchase Details
Closed on
Oct 17, 2003
Bought by
Kollefrath James A Jr & Wife Rev Living Trust
Purchase Details
Closed on
Feb 24, 1986
Bought by
Kollerfrath James A Jr Imogene
Create a Home Valuation Report for This Property
The Home Valuation Report is an in-depth analysis detailing your home's value as well as a comparison with similar homes in the area
Home Values in the Area
Average Home Value in this Area
Purchase History
| Date | Buyer | Sale Price | Title Company |
|---|---|---|---|
| Reichert Gregory L | -- | None Available | |
| Josh Duke | $250,000 | -- | |
| Hamby Kenny | $17,500 | -- | |
| Kerstiens Construction Inc | $15,900 | -- | |
| Revocabl Kollefrath James A Jr | -- | -- | |
| Kollefrath James A Jr & Wife Rev Living Trust | -- | -- | |
| Kollerfrath James A Jr Imogene | -- | -- |
Source: Public Records
Tax History
| Year | Tax Paid | Tax Assessment Tax Assessment Total Assessment is a certain percentage of the fair market value that is determined by local assessors to be the total taxable value of land and additions on the property. | Land | Improvement |
|---|---|---|---|---|
| 2025 | $2,790 | $89,760 | $4,800 | $84,960 |
| 2024 | $2,790 | $89,760 | $4,800 | $84,960 |
| 2023 | $2,790 | $89,760 | $4,800 | $84,960 |
| 2022 | $2,827 | $90,960 | $6,000 | $84,960 |
| 2021 | $2,396 | $54,520 | $4,000 | $50,520 |
| 2020 | $2,396 | $54,520 | $4,000 | $50,520 |
| 2019 | $2,396 | $54,520 | $4,000 | $50,520 |
| 2018 | $2,396 | $54,520 | $4,000 | $50,520 |
| 2017 | $2,736 | $62,240 | $4,000 | $58,240 |
| 2016 | $2,736 | $62,240 | $4,000 | $58,240 |
| 2015 | $2,590 | $62,240 | $4,000 | $58,240 |
| 2014 | $2,289 | $55,000 | $4,000 | $51,000 |
Source: Public Records
Map
Nearby Homes
Your Personal Tour Guide
Ask me questions while you tour the home.