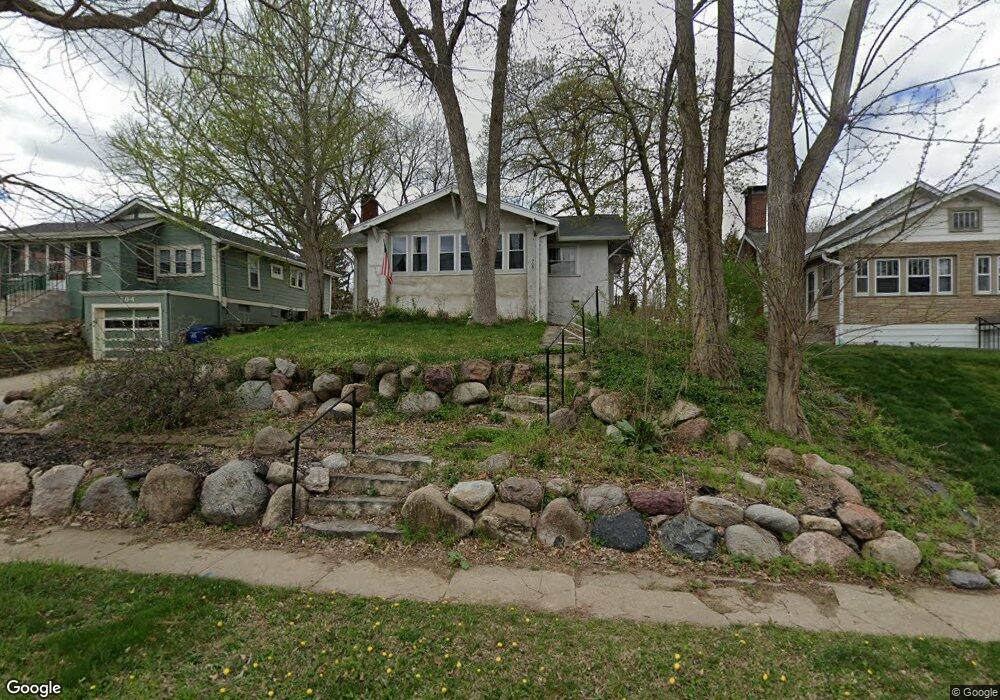
708 41st St Des Moines, IA 50312
North of Grand NeighborhoodEstimated Value: $155,000 - $213,000
2
Beds
2
Baths
888
Sq Ft
$197/Sq Ft
Est. Value
About This Home
This home is located at 708 41st St, Des Moines, IA 50312 and is currently estimated at $174,738, approximately $196 per square foot. 708 41st St is a home located in Polk County with nearby schools including Hubbell Elementary, Roosevelt High School, and Bergman Academy.
Ownership History
Date
Name
Owned For
Owner Type
Purchase Details
Closed on
Jun 4, 2018
Sold by
Voland Tamara L
Bought by
Bush John T and Bush J B
Current Estimated Value
Home Financials for this Owner
Home Financials are based on the most recent Mortgage that was taken out on this home.
Original Mortgage
$76,000
Outstanding Balance
$63,385
Interest Rate
3.12%
Mortgage Type
Adjustable Rate Mortgage/ARM
Estimated Equity
$111,353
Purchase Details
Closed on
Oct 24, 2013
Sold by
Voland Tamara L
Bought by
Bush John T and Bush Barbara Jeanne
Create a Home Valuation Report for This Property
The Home Valuation Report is an in-depth analysis detailing your home's value as well as a comparison with similar homes in the area
Home Values in the Area
Average Home Value in this Area
Purchase History
| Date | Buyer | Sale Price | Title Company |
|---|---|---|---|
| Bush John T | $85,000 | None Available | |
| Bush John T | -- | None Available |
Source: Public Records
Mortgage History
| Date | Status | Borrower | Loan Amount |
|---|---|---|---|
| Open | Bush John T | $76,000 |
Source: Public Records
Tax History Compared to Growth
Tax History
| Year | Tax Paid | Tax Assessment Tax Assessment Total Assessment is a certain percentage of the fair market value that is determined by local assessors to be the total taxable value of land and additions on the property. | Land | Improvement |
|---|---|---|---|---|
| 2025 | $2,498 | $154,400 | $50,500 | $103,900 |
| 2024 | $2,498 | $137,400 | $44,900 | $92,500 |
| 2023 | $2,806 | $137,400 | $44,900 | $92,500 |
| 2022 | $2,782 | $127,900 | $42,600 | $85,300 |
| 2021 | $2,682 | $127,900 | $42,600 | $85,300 |
| 2020 | $2,782 | $116,100 | $38,900 | $77,200 |
| 2019 | $2,498 | $116,100 | $38,900 | $77,200 |
| 2018 | $2,468 | $101,500 | $33,600 | $67,900 |
| 2017 | $2,190 | $101,500 | $33,600 | $67,900 |
| 2016 | $2,128 | $89,500 | $29,600 | $59,900 |
| 2015 | $2,128 | $89,500 | $29,600 | $59,900 |
| 2014 | $2,018 | $87,700 | $28,800 | $58,900 |
Source: Public Records
Map
Nearby Homes
- 689 42nd St
- 4012 Pleasant St
- 725 40th St
- 3908 Pleasant St
- 620 40th St
- 529 43rd St
- 744 37th St
- 4303 Crocker St
- 870 39th St
- 702 45th Place
- 3920 Grand Ave Unit 2TW
- 3920 Grand Ave Unit 5TE
- 4345 Grand Ave Unit 1
- 1001 42nd St
- 4323 Grand Ave Unit 216
- 4323 Grand Ave Unit 101
- 1008 Kingman Cir
- 4341 Grand Ave Unit 4
- 3525 Center St
- 708 35th St