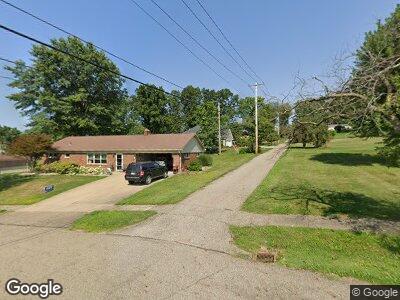
708 Beechy Dr SW Sugarcreek, OH 44681
Estimated Value: $324,000 - $401,000
3
Beds
2
Baths
1,585
Sq Ft
$229/Sq Ft
Est. Value
About This Home
This home is located at 708 Beechy Dr SW, Sugarcreek, OH 44681 and is currently estimated at $362,187, approximately $228 per square foot. 708 Beechy Dr SW is a home with nearby schools including Garaway High School.
Ownership History
Date
Name
Owned For
Owner Type
Purchase Details
Closed on
Sep 10, 2014
Sold by
Miller Paul L and Miller Miriam J
Bought by
Baab Jeffrey J and Baab Marsha M
Current Estimated Value
Home Financials for this Owner
Home Financials are based on the most recent Mortgage that was taken out on this home.
Original Mortgage
$160,500
Interest Rate
4.11%
Mortgage Type
Future Advance Clause Open End Mortgage
Purchase Details
Closed on
Apr 24, 2012
Sold by
Schrock Jeffrey A and Schrock Bonnie Lou
Bought by
Miller Paul L and Miller Miriam J
Purchase Details
Closed on
Feb 12, 2010
Sold by
Schrock Jeffrey A
Bought by
Schrock Jeffrey A and Schrock Bonnie Lou
Purchase Details
Closed on
Apr 6, 2006
Sold by
Osborne Pamela S and Osborne Clair W
Bought by
Schrock Jeffrey A and Schrock Anna Marie
Purchase Details
Closed on
Oct 17, 1989
Sold by
Miller Timothy and Gina Giselle-
Bought by
Miller Marvin S and Miller Rita R
Purchase Details
Closed on
Aug 11, 1988
Bought by
Baab Jeffrey J
Create a Home Valuation Report for This Property
The Home Valuation Report is an in-depth analysis detailing your home's value as well as a comparison with similar homes in the area
Home Values in the Area
Average Home Value in this Area
Purchase History
| Date | Buyer | Sale Price | Title Company |
|---|---|---|---|
| Baab Jeffrey J | $214,000 | None Available | |
| Miller Paul L | $33,000 | None Available | |
| Schrock Jeffrey A | -- | Tusc Title | |
| Schrock Jeffrey A | $37,500 | Mk Land Title | |
| Miller Marvin S | $6,000 | -- | |
| Baab Jeffrey J | $6,000 | -- |
Source: Public Records
Mortgage History
| Date | Status | Borrower | Loan Amount |
|---|---|---|---|
| Open | Baab Jeffrey J | $155,000 | |
| Closed | Baab Jeffrey J | $76,000 | |
| Closed | Baab Marsha M | $50,000 | |
| Closed | Baab Jeffrey J | $160,500 | |
| Closed | Schrock Jeffrey A | $27,799 |
Source: Public Records
Tax History Compared to Growth
Tax History
| Year | Tax Paid | Tax Assessment Tax Assessment Total Assessment is a certain percentage of the fair market value that is determined by local assessors to be the total taxable value of land and additions on the property. | Land | Improvement |
|---|---|---|---|---|
| 2024 | $6,796 | $265,210 | $63,270 | $201,940 |
| 2023 | $6,824 | $265,210 | $63,270 | $201,940 |
| 2022 | $3,647 | $92,824 | $22,145 | $70,679 |
| 2021 | $3,535 | $84,602 | $19,418 | $65,184 |
| 2020 | $3,545 | $84,602 | $19,418 | $65,184 |
| 2019 | $3,563 | $84,602 | $19,418 | $65,184 |
| 2018 | $2,862 | $71,400 | $16,390 | $55,010 |
| 2017 | $2,863 | $71,400 | $16,390 | $55,010 |
| 2016 | $286 | $71,400 | $16,390 | $55,010 |
| 2014 | $421 | $9,990 | $9,990 | $0 |
| 2013 | $398 | $9,990 | $9,990 | $0 |
Source: Public Records
Map
Nearby Homes
- 232 Church St SW
- 221 5th St SW
- 131 Maple St SW
- 0 Cherry Ridge Dr SW Unit 5106181
- 163 Heritage Crossing SE
- 9659 Yoder Rd SW
- 0 Yoder Rd SW
- 0 Winklepleck Rd NW
- 186 Pleasant Valley Rd SW
- 3004 Winklepleck Rd NW
- 3860 Township Road 162
- 3850 Township Road 162
- 5467 Old Route 39 NW
- 4991 Walnut St
- 3153 Boltz Orchard Rd SW
- 127 Buena Vista St
- 125 Buena Vista St
- 121 Buena Vista St
- 0 Hilltop Rd Unit 5119979
- 0 Hilltop Rd Unit 5119982
- 708 Beechy Dr SW
- 124 Ronsan St SW
- 136 Ronsan St SW
- 114 Ronsan St SW
- 760 W Main St
- 726 W Main St
- 144 Ronsan St SW
- 125 Ronsan St SW
- 734 W Main St
- 135 Ronsan St SW
- 115 Ronsan St SW
- 154 Ronsan St SW
- 143 Ronsan St SW
- 744 W Main St
- 729 Boston St SW
- 610 W Main St
- 735 Boston St SW
- 713 W Main St
- 723 W Main St
- 153 Ronsan St SW