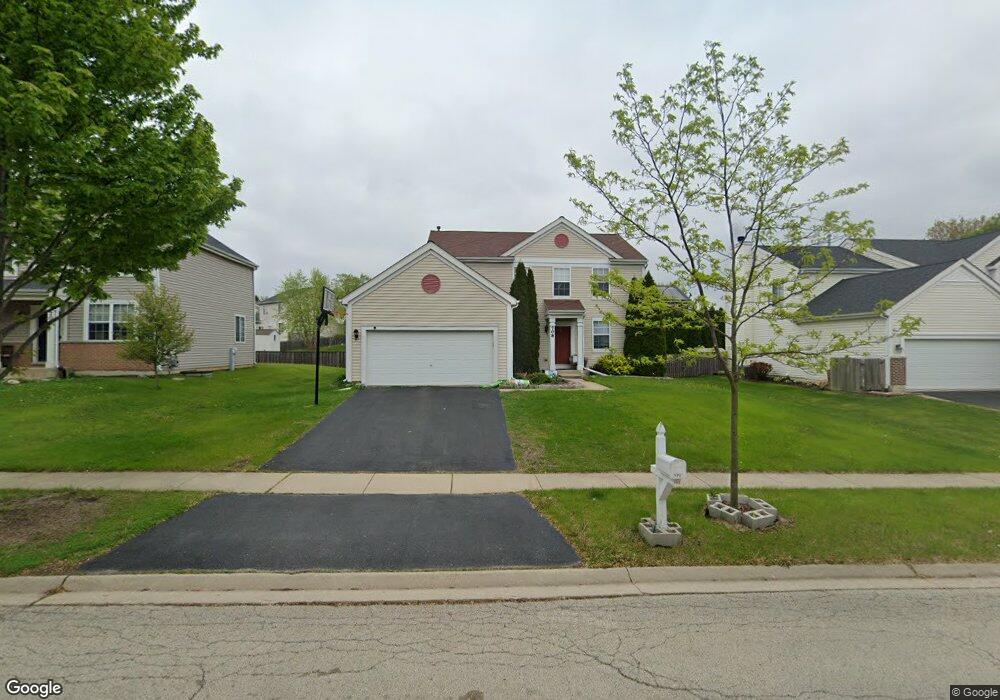
708 Camden Dr Minooka, IL 60447
North Minooka NeighborhoodEstimated Value: $360,000 - $384,000
--
Bed
1
Bath
2,122
Sq Ft
$177/Sq Ft
Est. Value
About This Home
This home is located at 708 Camden Dr, Minooka, IL 60447 and is currently estimated at $374,715, approximately $176 per square foot. 708 Camden Dr is a home located in Kendall County with nearby schools including Jones Elementary School, Minooka Junior High School, and Minooka Intermediate School.
Ownership History
Date
Name
Owned For
Owner Type
Purchase Details
Closed on
Mar 2, 2018
Sold by
Hassan Muhammed Z and Begum Munira
Bought by
Begum Munira
Current Estimated Value
Home Financials for this Owner
Home Financials are based on the most recent Mortgage that was taken out on this home.
Original Mortgage
$134,400
Outstanding Balance
$96,632
Interest Rate
4.22%
Mortgage Type
New Conventional
Estimated Equity
$278,083
Purchase Details
Closed on
Apr 7, 2010
Sold by
Begum Munira
Bought by
Hassan Muhammed Z and Begum Munira
Home Financials for this Owner
Home Financials are based on the most recent Mortgage that was taken out on this home.
Original Mortgage
$149,500
Interest Rate
5.03%
Mortgage Type
New Conventional
Purchase Details
Closed on
Dec 1, 2005
Sold by
Summerfield Venture Llc
Bought by
Begum Munira
Home Financials for this Owner
Home Financials are based on the most recent Mortgage that was taken out on this home.
Original Mortgage
$156,080
Interest Rate
6.46%
Mortgage Type
Purchase Money Mortgage
Create a Home Valuation Report for This Property
The Home Valuation Report is an in-depth analysis detailing your home's value as well as a comparison with similar homes in the area
Home Values in the Area
Average Home Value in this Area
Purchase History
| Date | Buyer | Sale Price | Title Company |
|---|---|---|---|
| Begum Munira | -- | Attorney | |
| Hassan Muhammed Z | -- | Chicago Title Insurance Co | |
| Begum Munira | $195,500 | Natc |
Source: Public Records
Mortgage History
| Date | Status | Borrower | Loan Amount |
|---|---|---|---|
| Open | Begum Munira | $134,400 | |
| Closed | Hassan Muhammed Z | $149,500 | |
| Previous Owner | Begum Munira | $156,080 |
Source: Public Records
Tax History Compared to Growth
Tax History
| Year | Tax Paid | Tax Assessment Tax Assessment Total Assessment is a certain percentage of the fair market value that is determined by local assessors to be the total taxable value of land and additions on the property. | Land | Improvement |
|---|---|---|---|---|
| 2024 | $8,567 | $109,025 | $15,425 | $93,600 |
| 2023 | $6,824 | $99,688 | $14,690 | $84,998 |
| 2022 | $6,824 | $86,261 | $13,990 | $72,271 |
| 2021 | $6,685 | $82,418 | $14,203 | $68,215 |
| 2020 | $6,622 | $78,721 | $13,566 | $65,155 |
| 2019 | $6,669 | $77,283 | $13,318 | $63,965 |
| 2018 | $6,443 | $75,597 | $13,027 | $62,570 |
| 2017 | $6,318 | $71,188 | $13,027 | $58,161 |
| 2016 | $5,875 | $66,123 | $12,866 | $53,257 |
| 2015 | $5,593 | $62,753 | $12,210 | $50,543 |
| 2014 | -- | $60,795 | $12,210 | $48,585 |
| 2013 | -- | $60,795 | $12,210 | $48,585 |
Source: Public Records
Map
Nearby Homes
- 1419 Kettleson Dr
- 603 Briarcliff Dr
- 814 Daniel Dr
- 844 Daniel Dr
- 2041 Isabella Ln
- 2033 Isabella
- 194 acres W Holt Rd
- Lot 1 Minooka Ridge & Jones Rd
- 103 E Coady Dr
- LOT 1 Bob Blair Rd
- 201 W Church St
- 308 Wabasso Place
- 405 W Mondamin St
- 101 Fieldcrest Ct
- 401 Feeney Dr
- 504 Flanagan Dr Unit A
- 107 Sibley Dr
- LOT 28 O Toole Dr
- 817 Casey Dr
- 406 Mccoy Ct
- 704 Camden Dr
- 712 Camden Dr
- 627 Tremont Dr
- 631 Tremont Dr
- 700 Camden Dr
- 713 Camden Dr
- 717 Camden Dr
- 623 Tremont Dr
- 709 Camden Dr
- 628 Camden Dr
- 705 Camden Dr
- 625 Briarcliff Dr
- 627 Briarcliff Dr
- 623 Briarcliff Dr
- 621 Briarcliff Dr
- 621 Briarcliff Dr Unit 621
- 624 Camden Dr Unit 1
- 619 Tremont Dr
- 629 Briarcliff Dr Unit 1
- 619 Briarcliff Dr