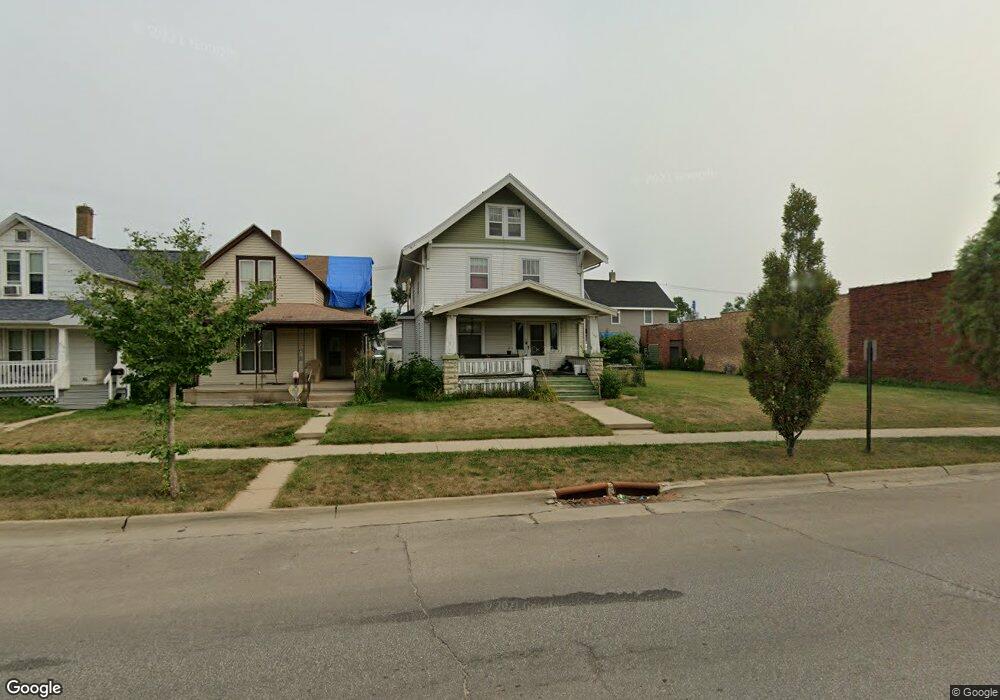
708 E Ave NW Cedar Rapids, IA 52405
Northwest Area NeighborhoodEstimated Value: $156,745 - $173,000
3
Beds
1
Bath
1,186
Sq Ft
$138/Sq Ft
Est. Value
About This Home
This home is located at 708 E Ave NW, Cedar Rapids, IA 52405 and is currently estimated at $163,936, approximately $138 per square foot. 708 E Ave NW is a home located in Linn County with nearby schools including Harrison Elementary School, Roosevelt Creative Corridor Business Academy, and Thomas Jefferson High School.
Ownership History
Date
Name
Owned For
Owner Type
Purchase Details
Closed on
Apr 22, 2025
Sold by
Miller Daniel L and Miller-Miller Shannon
Bought by
Miller Dustin L
Current Estimated Value
Home Financials for this Owner
Home Financials are based on the most recent Mortgage that was taken out on this home.
Original Mortgage
$130,500
Outstanding Balance
$129,806
Interest Rate
6.67%
Mortgage Type
New Conventional
Estimated Equity
$34,130
Create a Home Valuation Report for This Property
The Home Valuation Report is an in-depth analysis detailing your home's value as well as a comparison with similar homes in the area
Home Values in the Area
Average Home Value in this Area
Purchase History
| Date | Buyer | Sale Price | Title Company |
|---|---|---|---|
| Miller Dustin L | $150,000 | None Listed On Document |
Source: Public Records
Mortgage History
| Date | Status | Borrower | Loan Amount |
|---|---|---|---|
| Open | Miller Dustin L | $130,500 |
Source: Public Records
Tax History
| Year | Tax Paid | Tax Assessment Tax Assessment Total Assessment is a certain percentage of the fair market value that is determined by local assessors to be the total taxable value of land and additions on the property. | Land | Improvement |
|---|---|---|---|---|
| 2025 | $1,874 | $146,100 | $49,500 | $96,600 |
| 2024 | $1,874 | $121,100 | $25,000 | $96,100 |
| 2023 | $1,874 | $105,400 | $22,000 | $83,400 |
| 2022 | $1,736 | $97,700 | $22,000 | $75,700 |
| 2021 | $1,750 | $92,800 | $22,000 | $70,800 |
| 2020 | $1,750 | $87,900 | $16,000 | $71,900 |
| 2019 | $1,654 | $85,300 | $14,000 | $71,300 |
| 2018 | $1,536 | $85,300 | $14,000 | $71,300 |
| 2017 | $1,514 | $78,000 | $14,000 | $64,000 |
| 2016 | $1,657 | $78,000 | $14,000 | $64,000 |
| 2015 | $1,733 | $81,437 | $14,000 | $67,437 |
| 2014 | $1,548 | $81,437 | $14,000 | $67,437 |
| 2013 | $1,510 | $81,437 | $14,000 | $67,437 |
Source: Public Records
Map
Nearby Homes
Your Personal Tour Guide
Ask me questions while you tour the home.