Estimated Value: $175,000 - $206,000
3
Beds
2
Baths
1,230
Sq Ft
$154/Sq Ft
Est. Value
About This Home
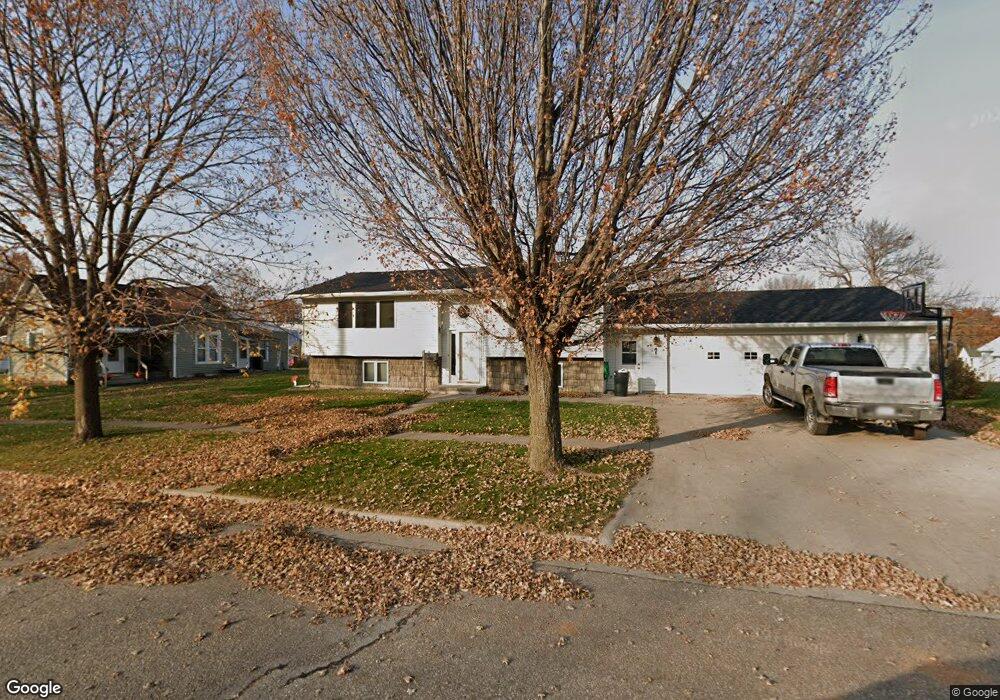
This home is located at 708 Elm St, Traer, IA 50675 and is currently estimated at $189,384, approximately $153 per square foot. 708 Elm St is a home with nearby schools including North Tama Elementary School and North Tama High School.
Ownership History
Date
Name
Owned For
Owner Type
Purchase Details
Closed on
May 10, 2017
Sold by
John Buresh
Bought by
Bell Zachary and Bell Leslie
Current Estimated Value
Home Financials for this Owner
Home Financials are based on the most recent Mortgage that was taken out on this home.
Original Mortgage
$104,000
Outstanding Balance
$86,298
Interest Rate
4.02%
Estimated Equity
$103,086
Purchase Details
Closed on
Sep 10, 2015
Sold by
Seebach Lee Gordon
Bought by
Buresh John M and Buresh Cynthia M
Create a Home Valuation Report for This Property
The Home Valuation Report is an in-depth analysis detailing your home's value as well as a comparison with similar homes in the area
Purchase History
| Date | Buyer | Sale Price | Title Company |
|---|---|---|---|
| Bell Zachary | -- | -- | |
| Buresh John M | $26,000 | None Available |
Source: Public Records
Mortgage History
| Date | Status | Borrower | Loan Amount |
|---|---|---|---|
| Open | Bell Zachary | $104,000 | |
| Closed | Bell Zachary | -- |
Source: Public Records
Tax History
| Year | Tax Paid | Tax Assessment Tax Assessment Total Assessment is a certain percentage of the fair market value that is determined by local assessors to be the total taxable value of land and additions on the property. | Land | Improvement |
|---|---|---|---|---|
| 2024 | $3,178 | $170,420 | $26,500 | $143,920 |
| 2023 | $2,992 | $170,420 | $26,500 | $143,920 |
| 2022 | $3,094 | $159,280 | $26,500 | $132,780 |
| 2021 | $3,050 | $160,150 | $27,450 | $132,700 |
| 2020 | $26 | $150,560 | $27,450 | $123,110 |
| 2019 | $2,556 | $122,490 | $0 | $0 |
| 2018 | $2,466 | $122,490 | $0 | $0 |
| 2017 | $2,466 | $109,660 | $0 | $0 |
| 2016 | $1,982 | $109,660 | $8,280 | $101,380 |
| 2015 | $1,940 | $109,660 | $8,280 | $101,380 |
| 2014 | $1,940 | $110,410 | $11,040 | $99,370 |
Source: Public Records
Map
Nearby Homes
Your Personal Tour Guide
Ask me questions while you tour the home.