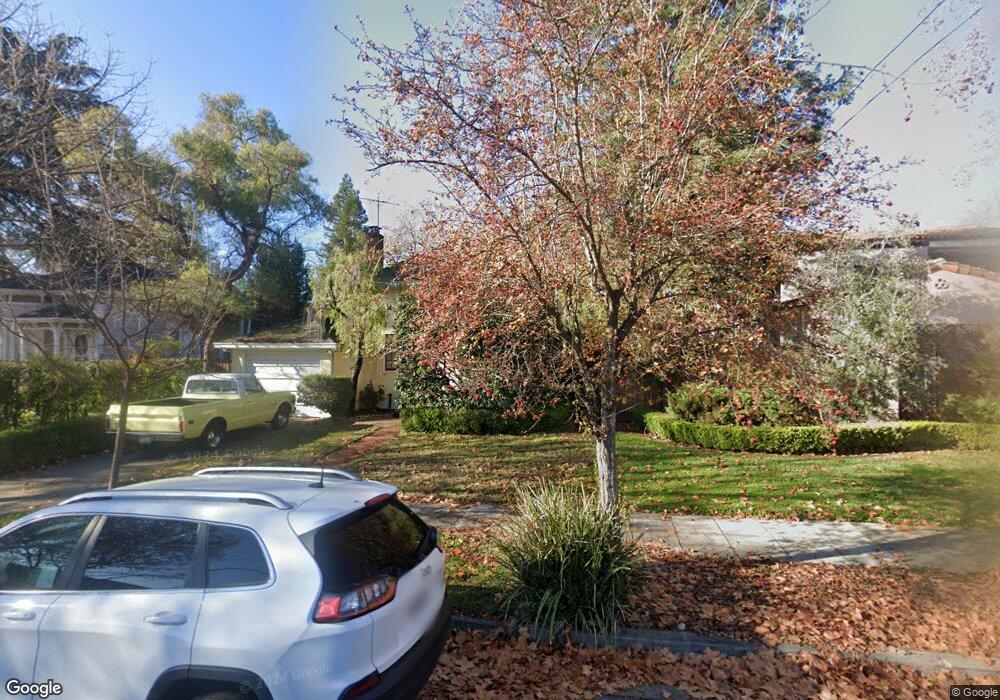
708 Elm St Woodland, CA 95695
Estimated Value: $339,000 - $520,000
2
Beds
1
Bath
1,214
Sq Ft
$357/Sq Ft
Est. Value
About This Home
This home is located at 708 Elm St, Woodland, CA 95695 and is currently estimated at $432,938, approximately $356 per square foot. 708 Elm St is a home located in Yolo County with nearby schools including Dingle Elementary School, Lee Middle School, and Woodland Senior High School.
Ownership History
Date
Name
Owned For
Owner Type
Purchase Details
Closed on
Oct 4, 2014
Sold by
Danli Stephen Joseph and Danli Mary
Bought by
The Stephen Joseph Danli & Mary Catherin
Current Estimated Value
Purchase Details
Closed on
Jan 6, 2003
Sold by
Geer William and Geer Barbara
Bought by
Danli Steve and Danli Mary
Home Financials for this Owner
Home Financials are based on the most recent Mortgage that was taken out on this home.
Original Mortgage
$188,000
Outstanding Balance
$80,437
Interest Rate
6.06%
Estimated Equity
$352,501
Create a Home Valuation Report for This Property
The Home Valuation Report is an in-depth analysis detailing your home's value as well as a comparison with similar homes in the area
Home Values in the Area
Average Home Value in this Area
Purchase History
| Date | Buyer | Sale Price | Title Company |
|---|---|---|---|
| The Stephen Joseph Danli & Mary Catherin | -- | None Available | |
| Danli Steve | $235,000 | North American Title |
Source: Public Records
Mortgage History
| Date | Status | Borrower | Loan Amount |
|---|---|---|---|
| Open | Danli Steve | $188,000 |
Source: Public Records
Tax History Compared to Growth
Tax History
| Year | Tax Paid | Tax Assessment Tax Assessment Total Assessment is a certain percentage of the fair market value that is determined by local assessors to be the total taxable value of land and additions on the property. | Land | Improvement |
|---|---|---|---|---|
| 2025 | $3,435 | $340,335 | $130,338 | $209,997 |
| 2023 | $3,435 | $327,122 | $125,278 | $201,844 |
| 2022 | $3,298 | $320,709 | $122,822 | $197,887 |
| 2021 | $3,243 | $314,421 | $120,414 | $194,007 |
| 2020 | $3,197 | $311,198 | $119,180 | $192,018 |
| 2019 | $3,135 | $305,097 | $116,844 | $188,253 |
| 2018 | $3,102 | $299,115 | $114,553 | $184,562 |
| 2017 | $3,033 | $293,251 | $112,307 | $180,944 |
| 2016 | $2,688 | $260,000 | $80,000 | $180,000 |
| 2015 | $2,688 | $260,000 | $80,000 | $180,000 |
| 2014 | $2,584 | $250,000 | $70,000 | $180,000 |
Source: Public Records
Map
Nearby Homes