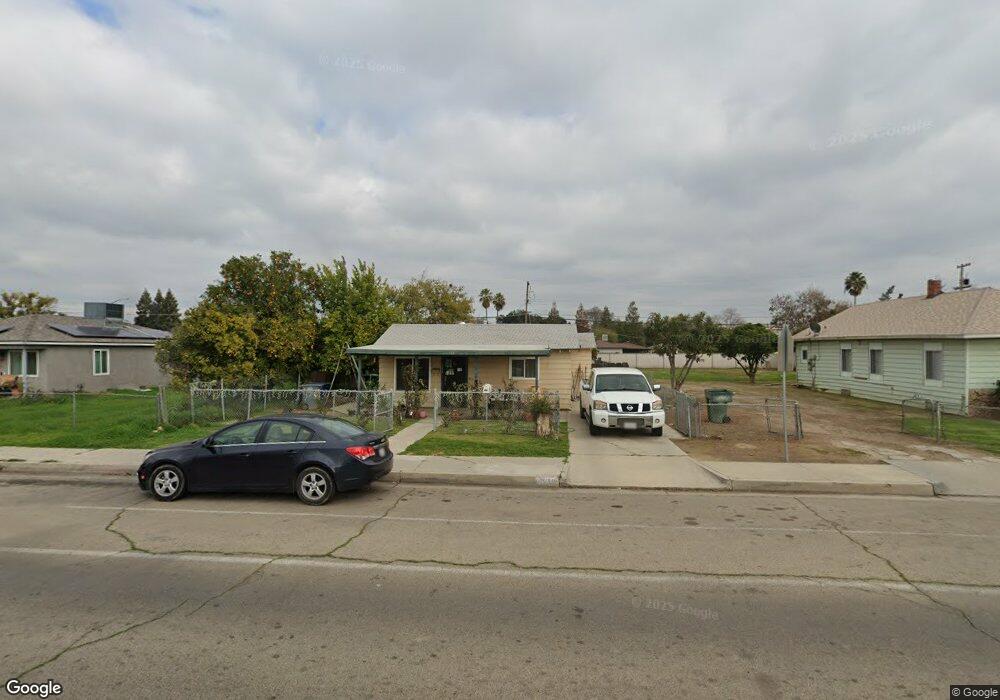
708 Faller Ave Sanger, CA 93657
Estimated Value: $218,000 - $240,858
2
Beds
1
Bath
920
Sq Ft
$248/Sq Ft
Est. Value
About This Home
This home is located at 708 Faller Ave, Sanger, CA 93657 and is currently estimated at $228,619, approximately $248 per square foot. 708 Faller Ave is a home located in Fresno County with nearby schools including Wilson Elementary School, Washington Academic Middle School, and Sanger High School.
Ownership History
Date
Name
Owned For
Owner Type
Purchase Details
Closed on
Oct 20, 2023
Sold by
Flores Maria Guadalupe
Bought by
Maria G Flores 2023 Revocable Trust and Flores
Current Estimated Value
Purchase Details
Closed on
Nov 26, 2007
Sold by
Davis Diana
Bought by
Flores Maria Guadalupe
Purchase Details
Closed on
Jun 29, 2007
Sold by
Flores Maria Guadalupe
Bought by
Davis Diana
Purchase Details
Closed on
Jul 27, 1998
Sold by
Gregoria Rodriquez
Bought by
Flores Maria Guadalupe
Purchase Details
Closed on
Aug 28, 1997
Sold by
Gregoria Rodriquez
Bought by
Flores Maria Guadalupe and Rodriguez Gregoria
Create a Home Valuation Report for This Property
The Home Valuation Report is an in-depth analysis detailing your home's value as well as a comparison with similar homes in the area
Home Values in the Area
Average Home Value in this Area
Purchase History
| Date | Buyer | Sale Price | Title Company |
|---|---|---|---|
| Maria G Flores 2023 Revocable Trust | -- | None Listed On Document | |
| Flores Maria Guadalupe | -- | None Available | |
| Davis Diana | -- | None Available | |
| Flores Maria Guadalupe | -- | -- | |
| Flores Maria Guadalupe | -- | -- |
Source: Public Records
Tax History
| Year | Tax Paid | Tax Assessment Tax Assessment Total Assessment is a certain percentage of the fair market value that is determined by local assessors to be the total taxable value of land and additions on the property. | Land | Improvement |
|---|---|---|---|---|
| 2025 | $2,615 | $205,549 | $91,938 | $113,611 |
| 2023 | $2,194 | $176,800 | $52,000 | $124,800 |
| 2022 | $2,120 | $170,000 | $50,000 | $120,000 |
| 2021 | $2,027 | $160,500 | $37,400 | $123,100 |
| 2020 | $1,969 | $159,000 | $37,100 | $121,900 |
| 2019 | $1,931 | $156,000 | $36,400 | $119,600 |
| 2018 | $1,852 | $153,000 | $35,700 | $117,300 |
| 2017 | $1,821 | $150,000 | $35,000 | $115,000 |
| 2016 | $1,688 | $145,000 | $30,000 | $115,000 |
| 2015 | $1,613 | $135,200 | $60,400 | $74,800 |
| 2014 | $1,522 | $126,700 | $56,600 | $70,100 |
Source: Public Records
Map
Nearby Homes
Your Personal Tour Guide
Ask me questions while you tour the home.