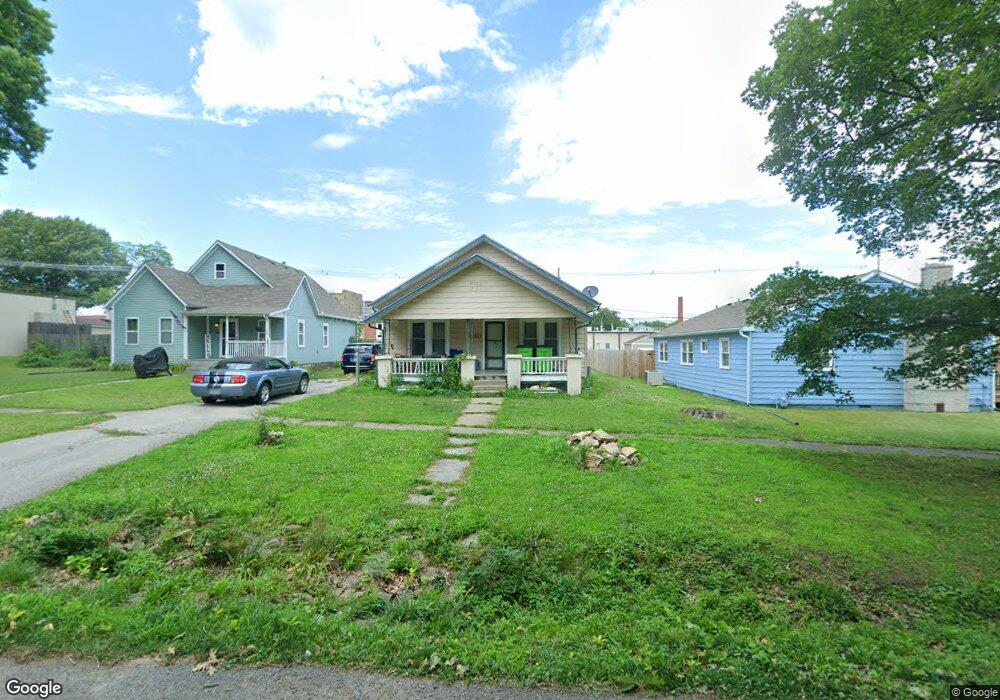
708 Indiana St Baldwin City, KS 66006
Estimated Value: $194,000 - $195,000
2
Beds
1
Bath
1,008
Sq Ft
$193/Sq Ft
Est. Value
About This Home
This home is located at 708 Indiana St, Baldwin City, KS 66006 and is currently estimated at $194,596, approximately $193 per square foot. 708 Indiana St is a home located in Douglas County with nearby schools including Baldwin Elementary Primary Center, Baldwin Elementary Intermediate Center, and Baldwin Junior High School.
Ownership History
Date
Name
Owned For
Owner Type
Purchase Details
Closed on
Sep 14, 2021
Sold by
Jaeger Nancy A
Bought by
Manns Apiffeny
Current Estimated Value
Home Financials for this Owner
Home Financials are based on the most recent Mortgage that was taken out on this home.
Original Mortgage
$121,600
Outstanding Balance
$92,818
Interest Rate
2.1%
Mortgage Type
New Conventional
Estimated Equity
$101,778
Purchase Details
Closed on
Jul 14, 2009
Sold by
Martin Brett and Holmes Mindy R
Bought by
Deutsche Bank National Trust Company
Purchase Details
Closed on
Oct 17, 2002
Sold by
Duncan Richard W and Duncan Natalie A
Bought by
Martin Brett and Holmes Mindy R
Home Financials for this Owner
Home Financials are based on the most recent Mortgage that was taken out on this home.
Original Mortgage
$92,517
Interest Rate
6.09%
Mortgage Type
FHA
Create a Home Valuation Report for This Property
The Home Valuation Report is an in-depth analysis detailing your home's value as well as a comparison with similar homes in the area
Home Values in the Area
Average Home Value in this Area
Purchase History
| Date | Buyer | Sale Price | Title Company |
|---|---|---|---|
| Manns Apiffeny | -- | Kansas Secured Title | |
| Deutsche Bank National Trust Company | $141,997 | Continental Title Company | |
| Martin Brett | -- | Executive Title Inc |
Source: Public Records
Mortgage History
| Date | Status | Borrower | Loan Amount |
|---|---|---|---|
| Open | Manns Apiffeny | $121,600 | |
| Previous Owner | Martin Brett | $92,517 |
Source: Public Records
Tax History Compared to Growth
Tax History
| Year | Tax Paid | Tax Assessment Tax Assessment Total Assessment is a certain percentage of the fair market value that is determined by local assessors to be the total taxable value of land and additions on the property. | Land | Improvement |
|---|---|---|---|---|
| 2025 | $3,013 | $22,184 | $4,715 | $17,469 |
| 2024 | $3,013 | $21,965 | $3,450 | $18,515 |
| 2023 | $2,643 | $18,377 | $3,450 | $14,927 |
| 2022 | $2,591 | $17,480 | $3,450 | $14,030 |
| 2021 | $2,308 | $15,185 | $2,645 | $12,540 |
| 2020 | $2,142 | $13,996 | $2,645 | $11,351 |
| 2019 | $2,097 | $13,708 | $2,645 | $11,063 |
| 2018 | $2,007 | $12,913 | $2,415 | $10,498 |
| 2017 | $1,969 | $12,409 | $2,415 | $9,994 |
| 2016 | $1,808 | $11,627 | $2,415 | $9,212 |
| 2015 | -- | $11,006 | $2,415 | $8,591 |
| 2014 | -- | $11,155 | $2,415 | $8,740 |
Source: Public Records
Map
Nearby Homes
- 814 Indiana St
- 703 Jersey St
- 1019 8th St
- 1115 7th St
- 702 Newton St
- 908 Orange St
- 912 Orange St
- 1512 College St
- 120 Hillside Dr
- 1752 N 300th Rd
- 309 Washington St
- Lot 3 Trail View Dr
- Lot 5 Trail View Dr
- Lot 32 Settler Ln
- Lot 2 Trail View Dr
- Lot 13 Wagon Rd
- Lot 21 Blackjack Ln
- Lot 18 Blackjack Ln
- Lot 22 Blackjack Ln
- Lot 9 Wagon Rd