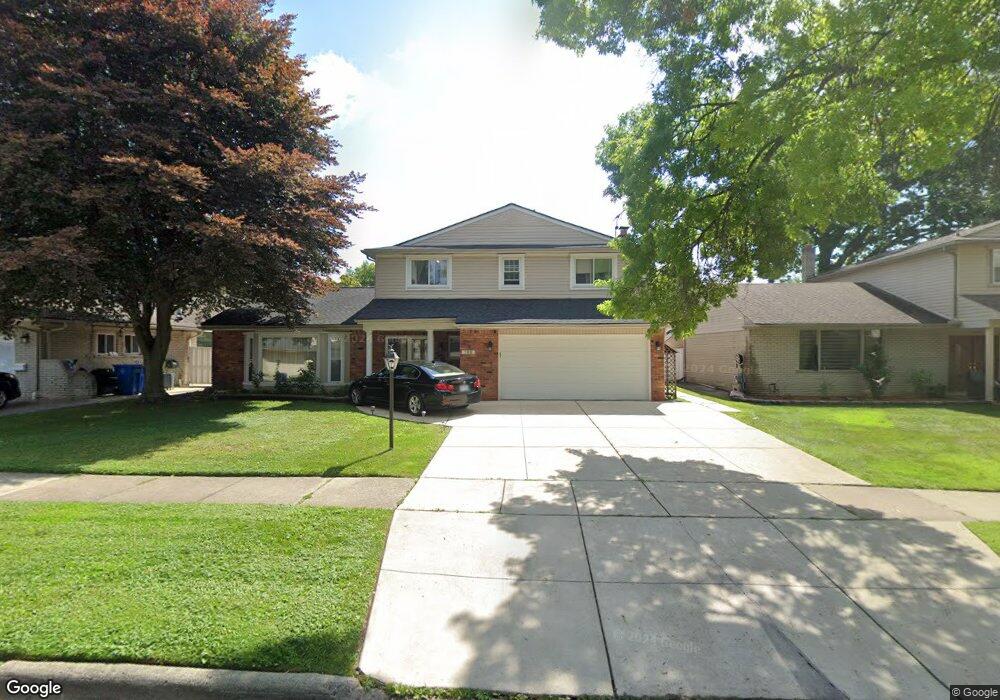
708 Kinloch St Dearborn Heights, MI 48127
Estimated Value: $565,000 - $662,000
4
Beds
3
Baths
1,970
Sq Ft
$304/Sq Ft
Est. Value
About This Home
This home is located at 708 Kinloch St, Dearborn Heights, MI 48127 and is currently estimated at $599,571, approximately $304 per square foot. 708 Kinloch St is a home located in Wayne County with nearby schools including Crestwood High School, Kinloch Elementary School, and Riverside Middle School.
Ownership History
Date
Name
Owned For
Owner Type
Purchase Details
Closed on
Apr 19, 2023
Sold by
Marwani Mohamed
Bought by
Saleh Amine and Marwani Mohamed
Current Estimated Value
Purchase Details
Closed on
Aug 13, 2020
Sold by
Yara Export Llc
Bought by
Marwani Mohamed
Purchase Details
Closed on
Jan 31, 2018
Sold by
Apex Wholesale Inc
Bought by
Yara Export Llc
Purchase Details
Closed on
Mar 30, 2017
Sold by
Marwani Samer and Fakih Dima
Bought by
Apex Wholesale Inc
Purchase Details
Closed on
Jun 9, 2011
Sold by
Marwani Samer
Bought by
Fifth Third Mortgage Company
Purchase Details
Closed on
Jul 14, 2009
Sold by
United Acquisitions Llc
Bought by
Marwani Samer
Purchase Details
Closed on
Feb 14, 2008
Sold by
Jett Stephanie
Bought by
Vanderbilt Mortgage & Finance Inc
Purchase Details
Closed on
Sep 9, 2005
Sold by
Anouti Zack and Anouti Zouhour
Bought by
Jett Stephanie
Create a Home Valuation Report for This Property
The Home Valuation Report is an in-depth analysis detailing your home's value as well as a comparison with similar homes in the area
Home Values in the Area
Average Home Value in this Area
Purchase History
| Date | Buyer | Sale Price | Title Company |
|---|---|---|---|
| Saleh Amine | -- | None Listed On Document | |
| Marwani Mohamed | $400,000 | Compass Title & Closing Svcs | |
| Yara Export Llc | -- | None Available | |
| Apex Wholesale Inc | -- | None Available | |
| Fifth Third Mortgage Company | $241,753 | None Available | |
| Marwani Samer | $242,000 | Complete Title Services Of S | |
| Vanderbilt Mortgage & Finance Inc | $242,200 | None Available | |
| Jett Stephanie | $399,900 | Multiple |
Source: Public Records
Tax History Compared to Growth
Tax History
| Year | Tax Paid | Tax Assessment Tax Assessment Total Assessment is a certain percentage of the fair market value that is determined by local assessors to be the total taxable value of land and additions on the property. | Land | Improvement |
|---|---|---|---|---|
| 2025 | $7,097 | $237,200 | $0 | $0 |
| 2024 | $7,097 | $230,200 | $0 | $0 |
| 2023 | $6,709 | $212,000 | $0 | $0 |
| 2022 | $9,082 | $189,300 | $0 | $0 |
| 2021 | $9,108 | $180,100 | $0 | $0 |
| 2019 | $13,120 | $162,200 | $0 | $0 |
| 2018 | $6,831 | $151,600 | $0 | $0 |
| 2017 | $2,970 | $143,500 | $0 | $0 |
| 2016 | $4,939 | $135,100 | $0 | $0 |
| 2015 | $9,450 | $129,000 | $0 | $0 |
| 2013 | $9,155 | $97,700 | $0 | $0 |
| 2010 | -- | $101,000 | $0 | $0 |
Source: Public Records
Map
Nearby Homes
- 741 Berwyn St
- 739 Kinloch St
- 852 N Beech Daly Rd Unit 7
- 26004 Shirley Ln
- 26006 Cherry Hill Rd
- 6 Canfield Cir
- 26290 Lawrence Dr
- 9 Canfield Cir
- 212 Shadowlawn St
- 148 Rosemary St
- 441 Highview St
- 242 S Evangeline St
- 1314 Highview St
- 26476 Stollman Dr
- 26444 Doxtator St
- 26204 Doxtator St
- 1866 N Evangeline St
- 381 S Beech Daly St
- 2207 Kinmore St
- 2219 Kinmore St