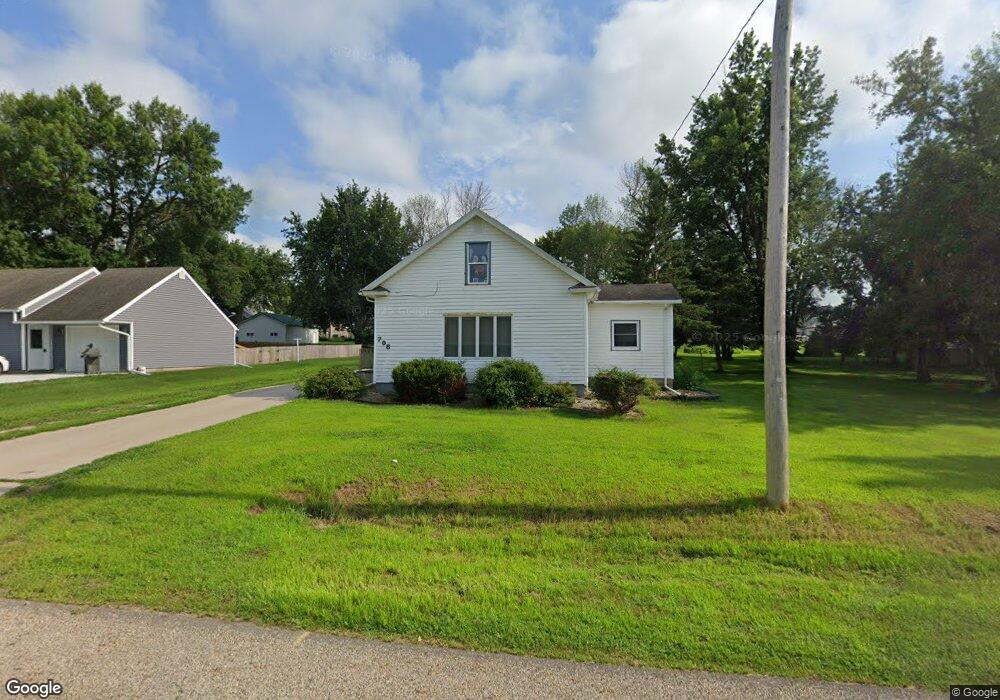
708 Leland St Little Rock, IA 51243
Estimated Value: $60,000 - $102,000
--
Bed
--
Bath
1,467
Sq Ft
$52/Sq Ft
Est. Value
About This Home
This home is located at 708 Leland St, Little Rock, IA 51243 and is currently estimated at $76,344, approximately $52 per square foot. 708 Leland St is a home located in Lyon County with nearby schools including George-Little Rock Senior High School.
Ownership History
Date
Name
Owned For
Owner Type
Purchase Details
Closed on
May 23, 2025
Sold by
Wiersma Timothy and Lane Angela Wiersma
Bought by
Terhark Noah
Current Estimated Value
Purchase Details
Closed on
Jun 1, 2020
Sold by
Borer Phyllis and Gross Mark
Bought by
Wiersma Timothy and Lane Angela
Home Financials for this Owner
Home Financials are based on the most recent Mortgage that was taken out on this home.
Original Mortgage
$38,250
Interest Rate
3.2%
Mortgage Type
Adjustable Rate Mortgage/ARM
Create a Home Valuation Report for This Property
The Home Valuation Report is an in-depth analysis detailing your home's value as well as a comparison with similar homes in the area
Home Values in the Area
Average Home Value in this Area
Purchase History
| Date | Buyer | Sale Price | Title Company |
|---|---|---|---|
| Terhark Noah | -- | None Listed On Document | |
| Wiersma Timothy | $42,500 | None Available |
Source: Public Records
Mortgage History
| Date | Status | Borrower | Loan Amount |
|---|---|---|---|
| Previous Owner | Wiersma Timothy | $38,250 |
Source: Public Records
Tax History Compared to Growth
Tax History
| Year | Tax Paid | Tax Assessment Tax Assessment Total Assessment is a certain percentage of the fair market value that is determined by local assessors to be the total taxable value of land and additions on the property. | Land | Improvement |
|---|---|---|---|---|
| 2025 | $546 | $62,227 | $11,367 | $50,860 |
| 2024 | $538 | $49,800 | $13,640 | $36,160 |
| 2023 | $538 | $49,800 | $13,640 | $36,160 |
| 2022 | $524 | $40,790 | $13,640 | $27,150 |
| 2021 | $524 | $40,790 | $13,640 | $27,150 |
| 2020 | $622 | $34,590 | $13,640 | $20,950 |
| 2019 | $462 | $33,230 | $0 | $0 |
| 2018 | $444 | $33,230 | $0 | $0 |
| 2017 | $366 | $28,760 | $0 | $0 |
| 2016 | $356 | $28,760 | $0 | $0 |
| 2015 | $356 | $29,337 | $0 | $0 |
| 2014 | $356 | $29,337 | $0 | $0 |
Source: Public Records
Map
Nearby Homes