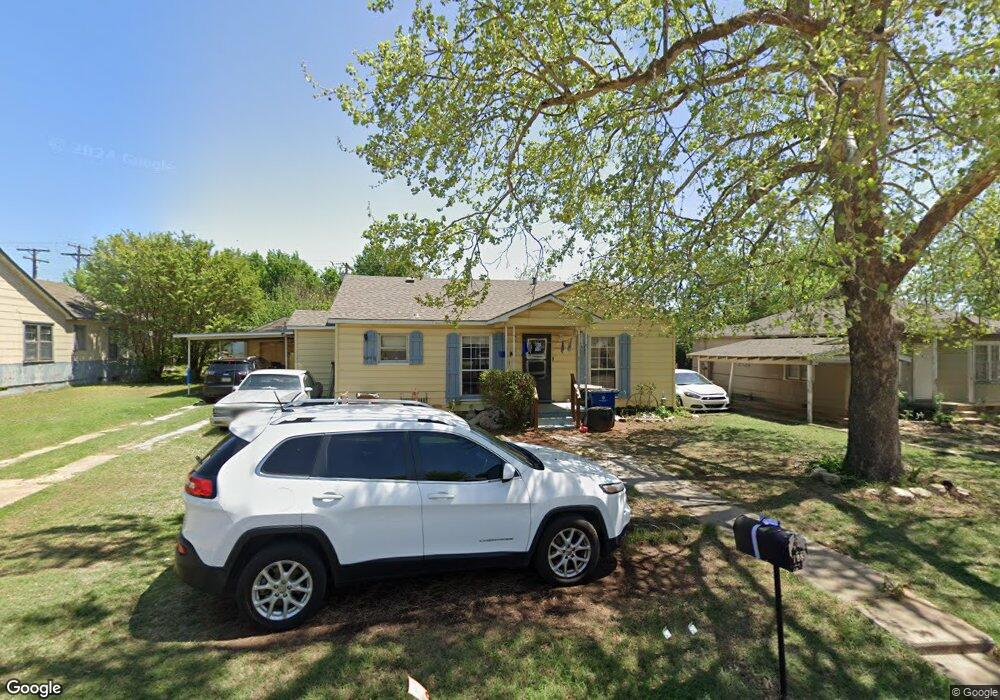
708 N C St Duncan, OK 73533
Estimated Value: $55,967 - $71,000
3
Beds
2
Baths
1,240
Sq Ft
$51/Sq Ft
Est. Value
About This Home
This home is located at 708 N C St, Duncan, OK 73533 and is currently estimated at $63,242, approximately $51 per square foot. 708 N C St is a home located in Stephens County with nearby schools including Woodrow Wilson Elementary School, Duncan Middle School, and Duncan High School.
Ownership History
Date
Name
Owned For
Owner Type
Purchase Details
Closed on
May 5, 2008
Sold by
Mcfatridge Johnny C and Mcfatridge Nancy A
Bought by
Morris Travis Lee and Morris Frances Lavonne
Current Estimated Value
Purchase Details
Closed on
Jan 17, 2001
Sold by
Carreon Juan A
Purchase Details
Closed on
Jun 10, 1994
Sold by
Carreon Eva M
Create a Home Valuation Report for This Property
The Home Valuation Report is an in-depth analysis detailing your home's value as well as a comparison with similar homes in the area
Purchase History
| Date | Buyer | Sale Price | Title Company |
|---|---|---|---|
| Morris Travis Lee | -- | None Available | |
| -- | $14,000 | -- | |
| -- | -- | -- |
Source: Public Records
Tax History
| Year | Tax Paid | Tax Assessment Tax Assessment Total Assessment is a certain percentage of the fair market value that is determined by local assessors to be the total taxable value of land and additions on the property. | Land | Improvement |
|---|---|---|---|---|
| 2025 | $330 | $3,915 | $464 | $3,451 |
| 2024 | $303 | $3,552 | $464 | $3,088 |
| 2023 | $303 | $3,552 | $464 | $3,088 |
| 2022 | $274 | $3,383 | $464 | $2,919 |
| 2021 | $274 | $3,221 | $464 | $2,757 |
| 2020 | $252 | $2,922 | $464 | $2,458 |
| 2019 | $241 | $2,783 | $464 | $2,319 |
| 2018 | $252 | $2,971 | $461 | $2,510 |
| 2017 | $232 | $2,829 | $386 | $2,443 |
| 2016 | $218 | $2,567 | $366 | $2,201 |
| 2015 | $185 | $2,445 | $347 | $2,098 |
| 2014 | $185 | $2,328 | $328 | $2,000 |
Source: Public Records
Map
Nearby Homes
Your Personal Tour Guide
Ask me questions while you tour the home.