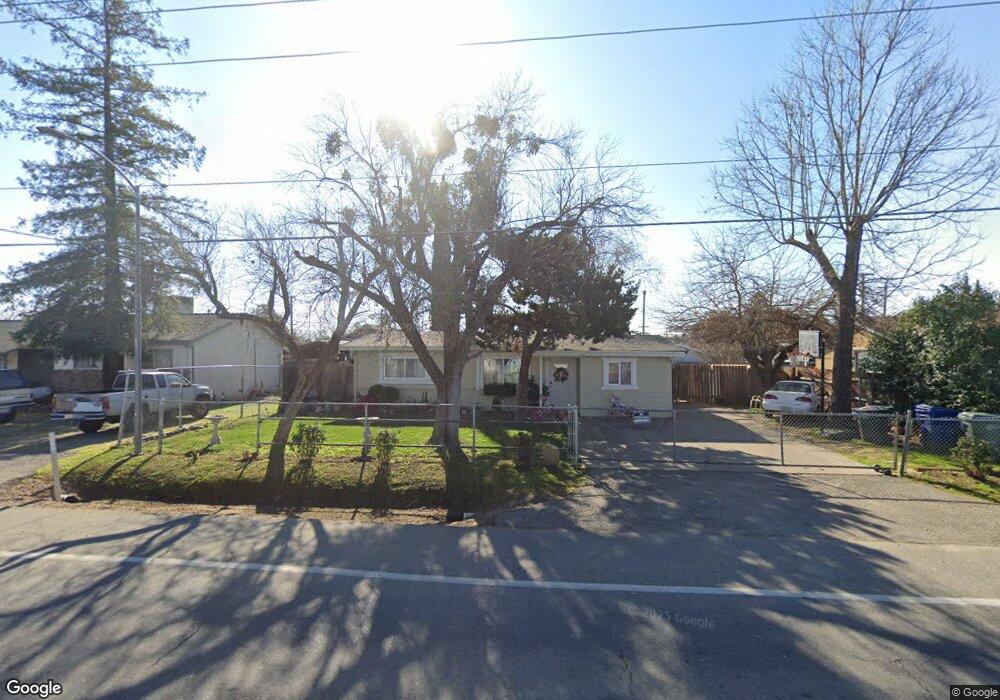
708 Q St Unit 1 Rio Linda, CA 95673
Estimated Value: $251,000 - $364,000
3
Beds
1
Bath
1,095
Sq Ft
$292/Sq Ft
Est. Value
About This Home
This home is located at 708 Q St Unit 1, Rio Linda, CA 95673 and is currently estimated at $319,833, approximately $292 per square foot. 708 Q St Unit 1 is a home located in Sacramento County with nearby schools including Dry Creek Elementary School, Rio Linda Preparatory Academy, and Westside Preparatory Charter School.
Ownership History
Date
Name
Owned For
Owner Type
Purchase Details
Closed on
Aug 24, 2012
Sold by
Duncan Rupert
Bought by
Carreno Angel L and Cruz Valentine F
Current Estimated Value
Purchase Details
Closed on
Feb 3, 2006
Sold by
Duncan Rupert
Bought by
Duncan Rupert
Home Financials for this Owner
Home Financials are based on the most recent Mortgage that was taken out on this home.
Original Mortgage
$250,200
Interest Rate
9.09%
Mortgage Type
Balloon
Purchase Details
Closed on
Mar 1, 2000
Sold by
Upchurch Robert F and Upchurch Jeanette A
Bought by
Duncan Rupert
Home Financials for this Owner
Home Financials are based on the most recent Mortgage that was taken out on this home.
Original Mortgage
$57,000
Interest Rate
8.27%
Mortgage Type
Seller Take Back
Purchase Details
Closed on
Jun 24, 1996
Sold by
Garrett Valerie K
Bought by
Upchurch Robert F and Upchurch Jeanette A
Create a Home Valuation Report for This Property
The Home Valuation Report is an in-depth analysis detailing your home's value as well as a comparison with similar homes in the area
Home Values in the Area
Average Home Value in this Area
Purchase History
| Date | Buyer | Sale Price | Title Company |
|---|---|---|---|
| Carreno Angel L | $52,000 | Orange Coast Title Company | |
| Duncan Rupert | -- | Alliance Title Company | |
| Duncan Rupert | $57,000 | -- | |
| Upchurch Robert F | -- | -- |
Source: Public Records
Mortgage History
| Date | Status | Borrower | Loan Amount |
|---|---|---|---|
| Previous Owner | Duncan Rupert | $250,200 | |
| Previous Owner | Duncan Rupert | $57,000 |
Source: Public Records
Tax History Compared to Growth
Tax History
| Year | Tax Paid | Tax Assessment Tax Assessment Total Assessment is a certain percentage of the fair market value that is determined by local assessors to be the total taxable value of land and additions on the property. | Land | Improvement |
|---|---|---|---|---|
| 2025 | $735 | $63,085 | $49,250 | $13,835 |
| 2024 | $735 | $61,849 | $48,285 | $13,564 |
| 2023 | $740 | $60,638 | $47,339 | $13,299 |
| 2022 | $698 | $59,450 | $46,411 | $13,039 |
| 2021 | $696 | $58,285 | $45,501 | $12,784 |
| 2020 | $899 | $57,688 | $45,035 | $12,653 |
| 2019 | $682 | $56,557 | $44,152 | $12,405 |
| 2018 | $649 | $55,449 | $43,287 | $12,162 |
| 2017 | $665 | $54,363 | $42,439 | $11,924 |
| 2016 | $665 | $53,298 | $41,607 | $11,691 |
| 2015 | $626 | $52,499 | $40,983 | $11,516 |
| 2014 | $638 | $51,472 | $40,181 | $11,291 |
Source: Public Records
Map
Nearby Homes
- 619 Quebec Way
- 6918 7th St
- 437 Silver Crest Cir
- 7024 10th St
- 7000 Rio Linda Blvd
- 7033 Castle Creek Way
- 325 Archway Ave
- 429 Arlingdale Cir
- 7313 Little Acorn Way
- 421 Penn Central Ct
- 7036 Dry Creek Rd
- 7608 Milldale Cir
- 6813 Shady Woods Way
- 518 Jamie Ct
- 7744 Elmont Ave
- 6544 Sunview Way
- 6626 Kenora St
- 7133 W 2nd St
- 0 W Delano St Unit 224130721
- 539 Harling Ct