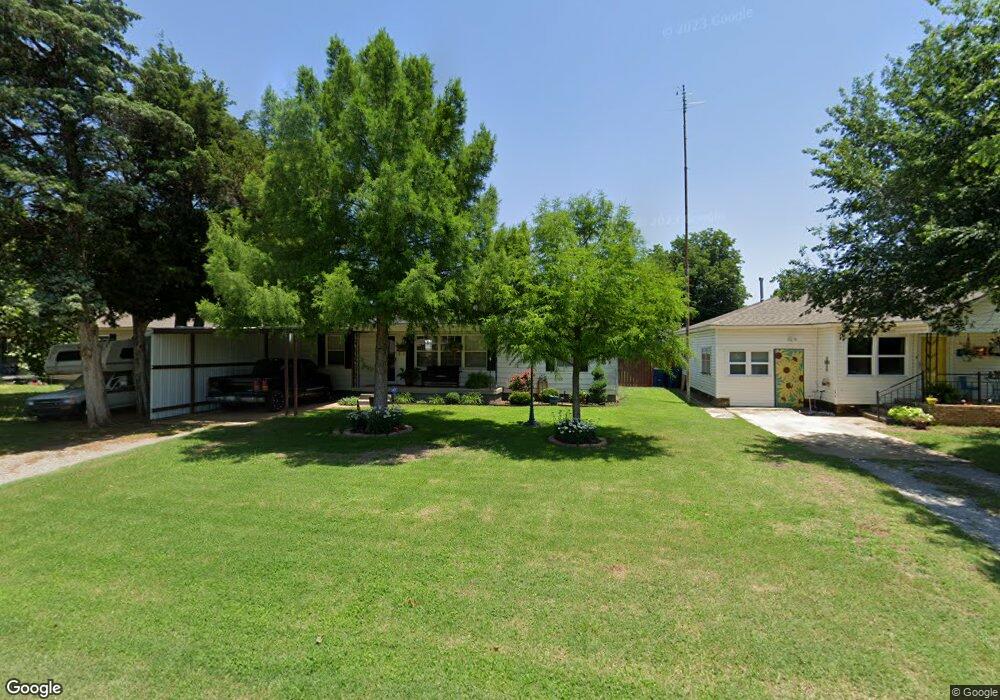
708 S 8th St Marlow, OK 73055
Estimated Value: $96,385 - $141,000
2
Beds
1
Bath
1,232
Sq Ft
$100/Sq Ft
Est. Value
About This Home
This home is located at 708 S 8th St, Marlow, OK 73055 and is currently estimated at $122,846, approximately $99 per square foot. 708 S 8th St is a home located in Stephens County with nearby schools including Marlow Elementary School, Marlow Middle School, and Marlow High School.
Ownership History
Date
Name
Owned For
Owner Type
Purchase Details
Closed on
Nov 13, 2017
Sold by
Davis Dustin and Davis Jamie
Bought by
Harris Haley C
Current Estimated Value
Home Financials for this Owner
Home Financials are based on the most recent Mortgage that was taken out on this home.
Original Mortgage
$69,000
Outstanding Balance
$57,650
Interest Rate
3.83%
Mortgage Type
Purchase Money Mortgage
Estimated Equity
$65,196
Purchase Details
Closed on
Aug 26, 2016
Sold by
Bohannan Vernon Clarence and Bohannan Clinten Lee
Bought by
Davies Dustin Shawn and Davies Jamie Laraye
Purchase Details
Closed on
Apr 7, 2015
Sold by
Mcgovern Tara May and Davies Tara Kay
Bought by
Davies Dustin and Davies Dustin Shawn
Purchase Details
Closed on
Apr 10, 2007
Sold by
Hornbuckle Julie R
Bought by
Davis Dustin and Davies Tara
Home Financials for this Owner
Home Financials are based on the most recent Mortgage that was taken out on this home.
Original Mortgage
$44,000
Interest Rate
6.1%
Mortgage Type
New Conventional
Create a Home Valuation Report for This Property
The Home Valuation Report is an in-depth analysis detailing your home's value as well as a comparison with similar homes in the area
Home Values in the Area
Average Home Value in this Area
Purchase History
| Date | Buyer | Sale Price | Title Company |
|---|---|---|---|
| Harris Haley C | $74,000 | None Available | |
| Davies Dustin Shawn | -- | Title 68 | |
| Davies Dustin | $35,000 | None Available | |
| Davis Dustin | $49,000 | None Available |
Source: Public Records
Mortgage History
| Date | Status | Borrower | Loan Amount |
|---|---|---|---|
| Open | Harris Haley C | $69,000 | |
| Previous Owner | Davis Dustin | $44,000 |
Source: Public Records
Tax History Compared to Growth
Tax History
| Year | Tax Paid | Tax Assessment Tax Assessment Total Assessment is a certain percentage of the fair market value that is determined by local assessors to be the total taxable value of land and additions on the property. | Land | Improvement |
|---|---|---|---|---|
| 2025 | $788 | $8,963 | $1,116 | $7,847 |
| 2024 | $788 | $8,703 | $1,116 | $7,587 |
| 2023 | $788 | $8,702 | $1,116 | $7,586 |
| 2022 | $841 | $8,613 | $1,116 | $7,497 |
| 2021 | $705 | $7,812 | $1,116 | $6,696 |
| 2020 | $721 | $7,712 | $1,116 | $6,596 |
| 2019 | $741 | $7,968 | $1,116 | $6,852 |
| 2018 | $751 | $8,143 | $331 | $7,812 |
| 2017 | $462 | $6,316 | $331 | $5,985 |
| 2016 | $445 | $5,840 | $331 | $5,509 |
| 2015 | $300 | $6,186 | $477 | $5,709 |
| 2014 | $300 | $6,186 | $477 | $5,709 |
Source: Public Records
Map
Nearby Homes
- 907 W Osage St
- 405 S 5th St
- 313 313 W Chickasaw
- 1007 S Broadway St
- 404 S 4th St
- 602 S 2nd St
- 212 212 S Broadway St
- ??? Highway 81
- 201 N 6th St
- 910 910 Willow Bend Dr
- 106 E Cheyenne Ave
- 416 St
- 208 W Apache St
- 506 N Broadway St
- 701 W McNeese St
- 503, 505, 507 E Main St
- 0 E Nabor Ave
- 1816 S Railroad St
- 282102 E 1650 Rd
- 511 W Steele St