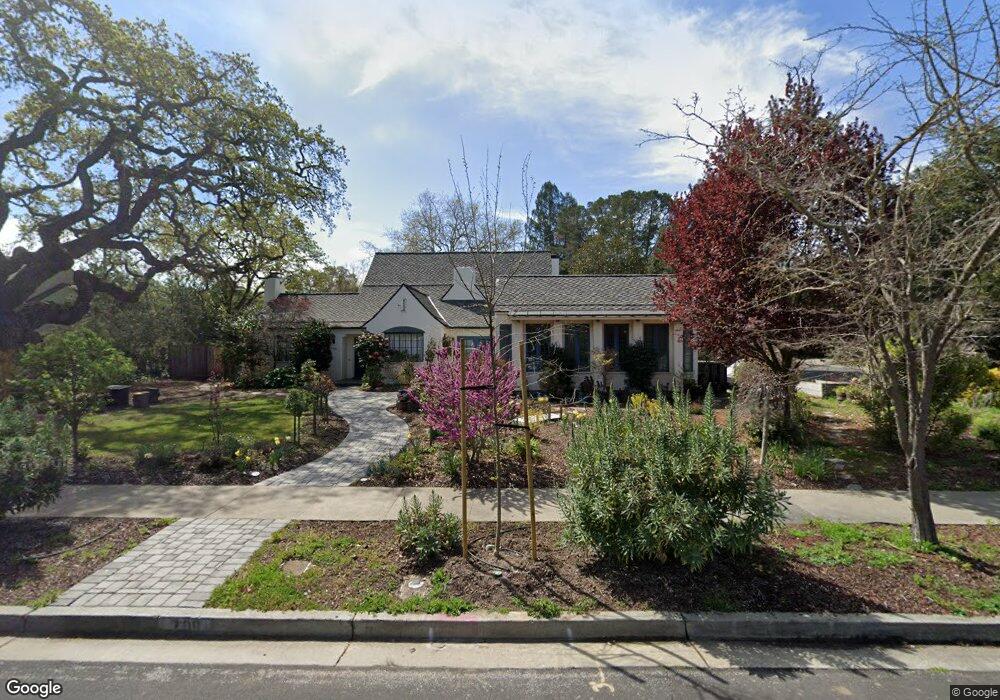
708 Salvatierra St Stanford, CA 94305
Estimated Value: $3,364,000 - $4,983,000
5
Beds
5
Baths
2,918
Sq Ft
$1,356/Sq Ft
Est. Value
About This Home
This home is located at 708 Salvatierra St, Stanford, CA 94305 and is currently estimated at $3,957,954, approximately $1,356 per square foot. 708 Salvatierra St is a home located in Santa Clara County with nearby schools including Escondido Elementary School, Frank S. Greene Jr. Middle, and Palo Alto High School.
Ownership History
Date
Name
Owned For
Owner Type
Purchase Details
Closed on
Jun 1, 1998
Sold by
Riley Edward T
Bought by
Riley Edward T and Riley Renee L
Current Estimated Value
Home Financials for this Owner
Home Financials are based on the most recent Mortgage that was taken out on this home.
Original Mortgage
$350,000
Outstanding Balance
$70,324
Interest Rate
7.1%
Estimated Equity
$3,887,630
Purchase Details
Closed on
Jun 11, 1996
Sold by
Goldstein Paul L and Goldstein Joann Thompson
Bought by
Board Of Trustees Of The Leland Stanford
Create a Home Valuation Report for This Property
The Home Valuation Report is an in-depth analysis detailing your home's value as well as a comparison with similar homes in the area
Home Values in the Area
Average Home Value in this Area
Purchase History
| Date | Buyer | Sale Price | Title Company |
|---|---|---|---|
| Riley Edward T | -- | Chicago Title Co | |
| Board Of Trustees Of The Leland Stanford | -- | First American Title Guarant |
Source: Public Records
Mortgage History
| Date | Status | Borrower | Loan Amount |
|---|---|---|---|
| Open | Riley Edward T | $350,000 |
Source: Public Records
Tax History Compared to Growth
Tax History
| Year | Tax Paid | Tax Assessment Tax Assessment Total Assessment is a certain percentage of the fair market value that is determined by local assessors to be the total taxable value of land and additions on the property. | Land | Improvement |
|---|---|---|---|---|
| 2025 | $30,011 | $2,526,535 | $1,970,274 | $556,261 |
| 2024 | $30,011 | $2,476,996 | $1,931,642 | $545,354 |
| 2023 | $29,560 | $2,428,428 | $1,893,767 | $534,661 |
| 2022 | $29,218 | $2,380,813 | $1,856,635 | $524,178 |
| 2021 | $28,617 | $2,334,131 | $1,820,231 | $513,900 |
| 2020 | $28,019 | $2,310,198 | $1,801,567 | $508,631 |
| 2019 | $27,688 | $2,264,901 | $1,766,243 | $498,658 |
| 2018 | $26,918 | $2,220,492 | $1,731,611 | $488,881 |
| 2017 | $26,432 | $2,176,954 | $1,697,658 | $479,296 |
| 2016 | $25,715 | $2,134,270 | $1,664,371 | $469,899 |
| 2015 | $25,428 | $2,102,212 | $1,639,371 | $462,841 |
| 2014 | $24,890 | $2,061,033 | $1,607,258 | $453,775 |
Source: Public Records
Map
Nearby Homes
- 78 Pearce Mitchell Place
- 843 Sonoma Terrace
- 103 Peter Coutts Cir
- 12 Peter Coutts Cir
- 72 Peter Coutts Cir
- 546 Oxford Ave
- 1630 Portola Ave
- 410 Sheridan Ave Unit 227
- 410 Sheridan Ave Unit 446
- 1555 Alma St
- 200 Sheridan Ave Unit 304
- 200 Sheridan Ave Unit 303
- 200 Sheridan Ave Unit 103
- 200 Sheridan Ave Unit 307
- 5 Plan at Acacia
- 4X Plan at Acacia
- 4 Plan at Acacia
- 3 Plan at Acacia
- 2A Plan at Acacia
- 2 Plan at Acacia
- 712 Salvatierra St
- 690 Salvatierra St
- 713 Mayfield Ave
- 707 Salvatierra St
- 690 Coronado Ave
- 716 Salvatierra St
- 711 Salvatierra St
- 691 Salvatierra St
- 680 Salvatierra St
- 719 Mayfield Ave
- 715 Salvatierra St
- 683 Salvatierra St
- 676 Mayfield Ave
- 668 Salvatierra St
- 724 Esplanada Way
- 611 Coronado Ave
- 723 Mayfield Ave
- 658 Mayfield Ave
- 746 Esplanada Way
- 710 Alvarado Row