708 W 6th St Davenport, IA 52802
Central Davenport NeighborhoodEstimated Value: $117,000 - $141,000
3
Beds
2
Baths
1,923
Sq Ft
$66/Sq Ft
Est. Value
About This Home
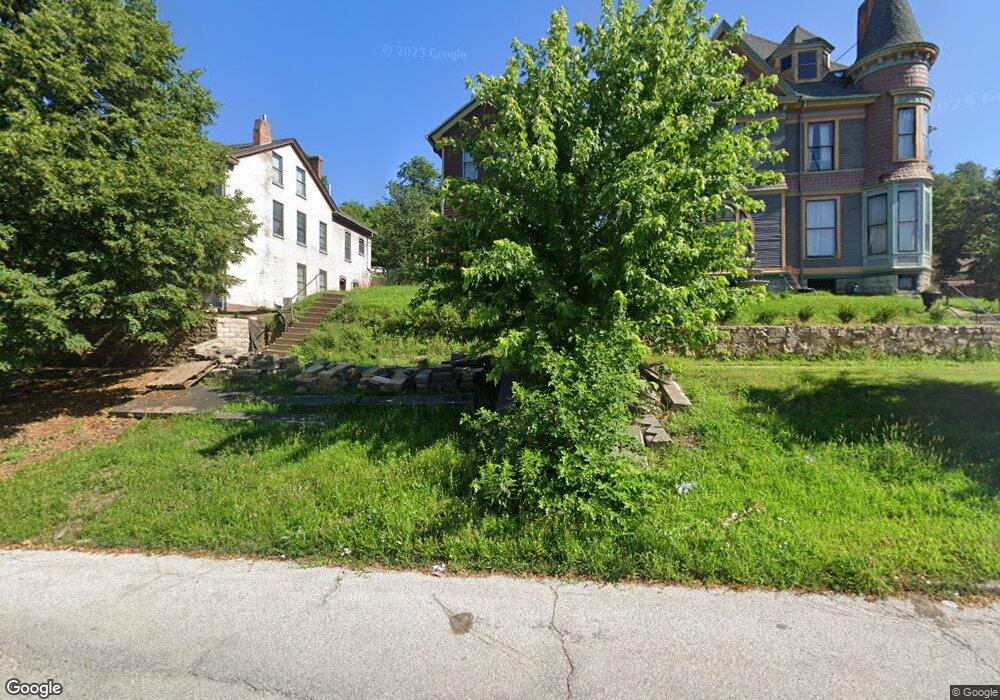
This home is located at 708 W 6th St, Davenport, IA 52802 and is currently estimated at $127,575, approximately $66 per square foot. 708 W 6th St is a home located in Scott County with nearby schools including Walnut Hill Elementary School, Christian County Middle School, and Casey County Middle School.
Ownership History
Date
Name
Owned For
Owner Type
Purchase Details
Closed on
Jan 3, 2015
Sold by
Rhomberg Penny B
Bought by
Rhomberg Matthew
Current Estimated Value
Purchase Details
Closed on
Jun 9, 2006
Sold by
Rhomberg Penny Buzzell
Bought by
Rhomberg Matthew
Purchase Details
Closed on
Aug 15, 2005
Sold by
Household Finance Industrial Loan Co Of
Bought by
Rhomberg Penny Buzzell
Create a Home Valuation Report for This Property
The Home Valuation Report is an in-depth analysis detailing your home's value as well as a comparison with similar homes in the area
Home Values in the Area
Average Home Value in this Area
Purchase History
| Date | Buyer | Sale Price | Title Company |
|---|---|---|---|
| Rhomberg Matthew | -- | None Available | |
| Rhomberg Matthew | -- | None Available | |
| Rhomberg Penny Buzzell | $25,500 | None Available |
Source: Public Records
Tax History Compared to Growth
Tax History
| Year | Tax Paid | Tax Assessment Tax Assessment Total Assessment is a certain percentage of the fair market value that is determined by local assessors to be the total taxable value of land and additions on the property. | Land | Improvement |
|---|---|---|---|---|
| 2025 | $1,530 | $96,740 | $9,470 | $87,270 |
| 2024 | $1,494 | $85,630 | $9,470 | $76,160 |
| 2023 | $1,362 | $85,630 | $9,470 | $76,160 |
| 2022 | $1,466 | $63,790 | $3,790 | $60,000 |
| 2021 | $1,368 | $63,790 | $3,790 | $60,000 |
| 2020 | $1,232 | $56,730 | $3,790 | $52,940 |
| 2019 | $1,272 | $56,730 | $3,790 | $52,940 |
| 2018 | $1,246 | $56,730 | $3,790 | $52,940 |
| 2017 | $1,290 | $56,730 | $3,790 | $52,940 |
| 2016 | $1,242 | $56,730 | $0 | $0 |
| 2015 | $1,242 | $57,270 | $0 | $0 |
| 2014 | $1,272 | $57,270 | $0 | $0 |
| 2013 | $1,250 | $0 | $0 | $0 |
| 2012 | -- | $41,970 | $4,510 | $37,460 |
Source: Public Records
Map
Nearby Homes