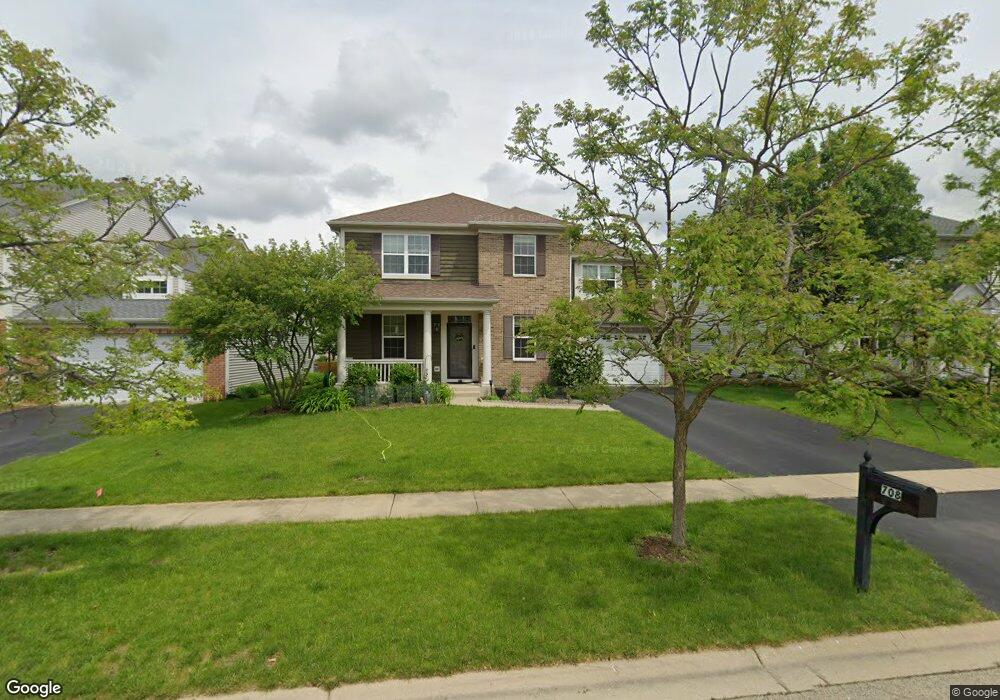
708 Wilmore Dr Oswego, IL 60543
North Oswego NeighborhoodEstimated Value: $505,000 - $552,000
4
Beds
3
Baths
3,596
Sq Ft
$147/Sq Ft
Est. Value
About This Home
This home is located at 708 Wilmore Dr, Oswego, IL 60543 and is currently estimated at $528,828, approximately $147 per square foot. 708 Wilmore Dr is a home located in Kendall County with nearby schools including Churchill Elementary School, Plank Junior High School, and Oswego East High School.
Ownership History
Date
Name
Owned For
Owner Type
Purchase Details
Closed on
May 26, 2017
Sold by
Ware Scott E Boul and Garza Barbara E
Bought by
Bhat Harshavardan Shivaram Gangolli and Bhat Niyata H
Current Estimated Value
Home Financials for this Owner
Home Financials are based on the most recent Mortgage that was taken out on this home.
Original Mortgage
$255,200
Outstanding Balance
$130,832
Interest Rate
3.37%
Mortgage Type
New Conventional
Estimated Equity
$397,996
Purchase Details
Closed on
Apr 4, 2007
Sold by
Boulware Scott E
Bought by
Boulware Scott E and Garza Barbara E
Home Financials for this Owner
Home Financials are based on the most recent Mortgage that was taken out on this home.
Original Mortgage
$40,000
Interest Rate
8.25%
Mortgage Type
Credit Line Revolving
Purchase Details
Closed on
Mar 4, 2005
Sold by
Pinnacle Corp
Bought by
Boulware Scott E
Home Financials for this Owner
Home Financials are based on the most recent Mortgage that was taken out on this home.
Original Mortgage
$279,050
Interest Rate
5.5%
Mortgage Type
Fannie Mae Freddie Mac
Create a Home Valuation Report for This Property
The Home Valuation Report is an in-depth analysis detailing your home's value as well as a comparison with similar homes in the area
Home Values in the Area
Average Home Value in this Area
Purchase History
| Date | Buyer | Sale Price | Title Company |
|---|---|---|---|
| Bhat Harshavardan Shivaram Gangolli | $319,000 | Greater Illions Title Co | |
| Boulware Scott E | -- | None Available | |
| Boulware Scott E | $349,000 | Chicago Title Insurance Co |
Source: Public Records
Mortgage History
| Date | Status | Borrower | Loan Amount |
|---|---|---|---|
| Open | Bhat Harshavardan Shivaram Gangolli | $255,200 | |
| Previous Owner | Boulware Scott E | $40,000 | |
| Previous Owner | Boulware Scott E | $320,000 | |
| Previous Owner | Boulware Scott E | $279,050 | |
| Closed | Boulware Scott E | $52,300 |
Source: Public Records
Tax History Compared to Growth
Tax History
| Year | Tax Paid | Tax Assessment Tax Assessment Total Assessment is a certain percentage of the fair market value that is determined by local assessors to be the total taxable value of land and additions on the property. | Land | Improvement |
|---|---|---|---|---|
| 2024 | $11,509 | $149,016 | $25,312 | $123,704 |
| 2023 | $10,481 | $133,050 | $22,600 | $110,450 |
| 2022 | $10,481 | $122,064 | $20,734 | $101,330 |
| 2021 | $9,572 | $108,300 | $19,378 | $88,922 |
| 2020 | $9,466 | $106,176 | $18,998 | $87,178 |
| 2019 | $9,875 | $108,872 | $18,998 | $89,874 |
| 2018 | $10,018 | $106,333 | $23,711 | $82,622 |
| 2017 | $10,008 | $103,623 | $22,160 | $81,463 |
| 2016 | $9,592 | $98,221 | $21,005 | $77,216 |
| 2015 | $9,698 | $94,900 | $20,295 | $74,605 |
| 2014 | -- | $89,528 | $19,146 | $70,382 |
| 2013 | -- | $90,024 | $19,252 | $70,772 |
Source: Public Records
Map
Nearby Homes
- 232 Julep Ave
- Easton Plan at Piper Glen - Classic Series
- Braxton Plan at Piper Glen - Somerset
- Hudson Plan at Piper Glen - Classic Series
- Clayton Plan at Piper Glen - Somerset
- Leyden Plan at Piper Glen - Smart Series
- Alden Plan at Piper Glen - Somerset
- Barclay Plan at Piper Glen - Classic Series
- 104 Piper Glen Ave
- Newbury Plan at Piper Glen - Smart Series
- Ellison Plan at Piper Glen - Somerset
- Deacon Plan at Piper Glen - Somerset
- Essex Plan at Piper Glen - Classic Series
- Lyndale Plan at Piper Glen - Classic Series
- Paxton Plan at Piper Glen - Smart Series
- Quinn Plan at Piper Glen - Smart Series
- Morgan Plan at Piper Glen - Smart Series
- Dunbar Plan at Piper Glen - Classic Series
- 102 Piper Glen Ave
- 633 Henry Ln
- 710 Wilmore Dr
- 706 Wilmore Dr
- 558 Cardinal Ave
- 704 Wilmore Dr
- 560 Cardinal Ave
- 556 Cardinal Ave
- 712 Wilmore Dr
- 562 Cardinal Ave
- 709 Wilmore Dr
- 554 Cardinal Ave
- 702 Wilmore Dr
- 707 Wilmore Dr
- 711 Wilmore Dr
- 705 Wilmore Dr
- 564 Cardinal Ave
- 713 Wilmore Dr
- 703 Wilmore Dr
- 611 Paris Ave
- 563 Cardinal Ave
- 508 Cardinal Ave