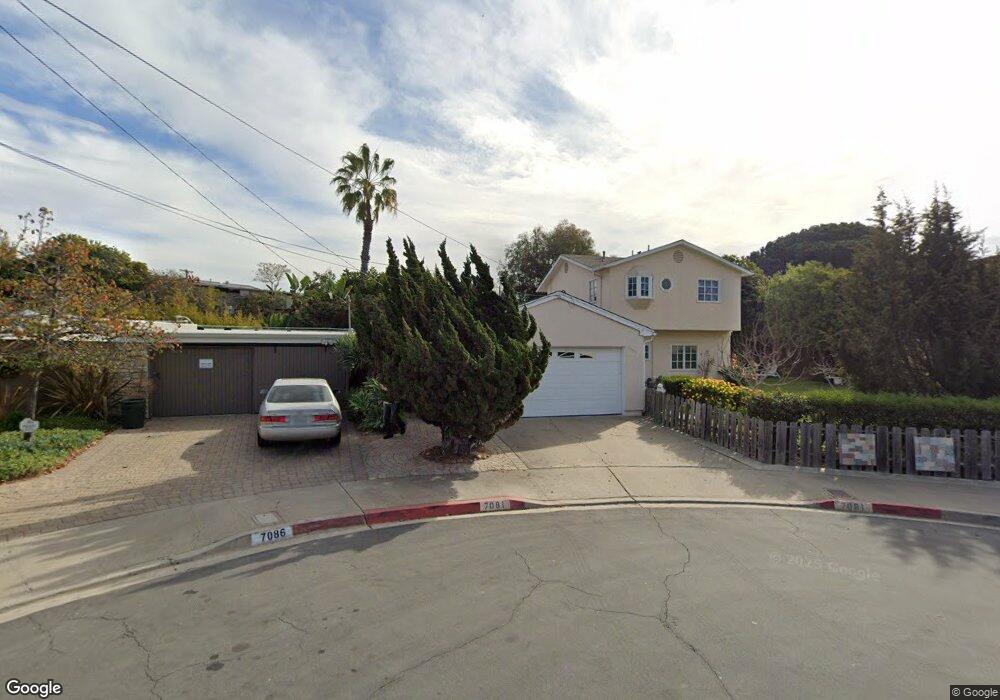
7081 Hilton Place San Diego, CA 92111
Clairemont Mesa East NeighborhoodEstimated Value: $1,082,000 - $1,177,979
4
Beds
3
Baths
1,881
Sq Ft
$595/Sq Ft
Est. Value
About This Home
This home is located at 7081 Hilton Place, San Diego, CA 92111 and is currently estimated at $1,119,745, approximately $595 per square foot. 7081 Hilton Place is a home located in San Diego County with nearby schools including Ross Elementary, Montgomery Middle School, and Kavod Charter School.
Ownership History
Date
Name
Owned For
Owner Type
Purchase Details
Closed on
May 9, 2007
Sold by
Magnin Michele C
Bought by
Magnin Michele C
Current Estimated Value
Purchase Details
Closed on
Aug 11, 2005
Sold by
Eaton Francis H and Magning Michele C
Bought by
Magnin Michele C
Home Financials for this Owner
Home Financials are based on the most recent Mortgage that was taken out on this home.
Original Mortgage
$330,000
Outstanding Balance
$175,687
Interest Rate
5.87%
Mortgage Type
Purchase Money Mortgage
Estimated Equity
$944,059
Purchase Details
Closed on
Jan 17, 2002
Sold by
Eaton Francis H and Magnin Michele C
Bought by
Eaton Francis H and Magnin Michele C
Home Financials for this Owner
Home Financials are based on the most recent Mortgage that was taken out on this home.
Original Mortgage
$204,200
Interest Rate
6.29%
Purchase Details
Closed on
Aug 17, 1984
Create a Home Valuation Report for This Property
The Home Valuation Report is an in-depth analysis detailing your home's value as well as a comparison with similar homes in the area
Home Values in the Area
Average Home Value in this Area
Purchase History
| Date | Buyer | Sale Price | Title Company |
|---|---|---|---|
| Magnin Michele C | -- | None Available | |
| Magnin Michele C | -- | Old Republic Title Company | |
| Eaton Francis H | -- | New Century Title Company | |
| Eaton Francis H | -- | New Century Title Company | |
| -- | $112,500 | -- |
Source: Public Records
Mortgage History
| Date | Status | Borrower | Loan Amount |
|---|---|---|---|
| Open | Magnin Michele C | $330,000 | |
| Previous Owner | Eaton Francis H | $204,200 |
Source: Public Records
Tax History Compared to Growth
Tax History
| Year | Tax Paid | Tax Assessment Tax Assessment Total Assessment is a certain percentage of the fair market value that is determined by local assessors to be the total taxable value of land and additions on the property. | Land | Improvement |
|---|---|---|---|---|
| 2025 | $4,126 | $346,925 | $97,097 | $249,828 |
| 2024 | $4,126 | $340,124 | $95,194 | $244,930 |
| 2023 | $4,033 | $333,456 | $93,328 | $240,128 |
| 2022 | $3,924 | $326,919 | $91,499 | $235,420 |
| 2021 | $3,896 | $320,509 | $89,705 | $230,804 |
| 2020 | $3,848 | $317,224 | $88,786 | $228,438 |
| 2019 | $3,778 | $311,005 | $87,046 | $223,959 |
| 2018 | $3,532 | $304,908 | $85,340 | $219,568 |
| 2017 | $80 | $298,930 | $83,667 | $215,263 |
| 2016 | $3,389 | $293,070 | $82,027 | $211,043 |
| 2015 | $3,338 | $288,668 | $80,795 | $207,873 |
| 2014 | $3,285 | $283,015 | $79,213 | $203,802 |
Source: Public Records
Map
Nearby Homes
- 3516 Atoll St
- 7029 Hilton Place
- 7131 Malta St
- 7045 Beagle St
- 3654 Marlesta Dr
- 3662 Marlesta Dr
- 7265 Arillo St
- 7273 Arillo St
- 3484 Armstrong St
- 6617 Rockglen Ave
- 7441 Beagle St
- 7003 E Batista St
- 3413 Rollsreach Dr
- 3373 Armstrong St
- 3405 Aveley Place
- 3781 Ashford St
- 3758 Antiem St
- 7434 Salerno St
- 3266 Ashford St Unit M
- 3230 Ashford St Unit A
- 7069 Hilton Place
- 3457 Beagle Place
- 7086 Hilton Place
- 3604 Atoll St
- 3560 Atoll St
- 7055 Hilton Place
- 3458 Beagle Place
- 3447 Beagle Place
- 3618 Atoll St
- 3546 Atoll St
- 7072 Hilton Place
- 7101 Malta St
- 7102 Frakes St
- 7058 Hilton Place
- 7041 Hilton Place
- 3530 Atoll St
- 3632 Atoll St
- 3448 Beagle Place
- 3437 Beagle Place
- 7044 Hilton Place