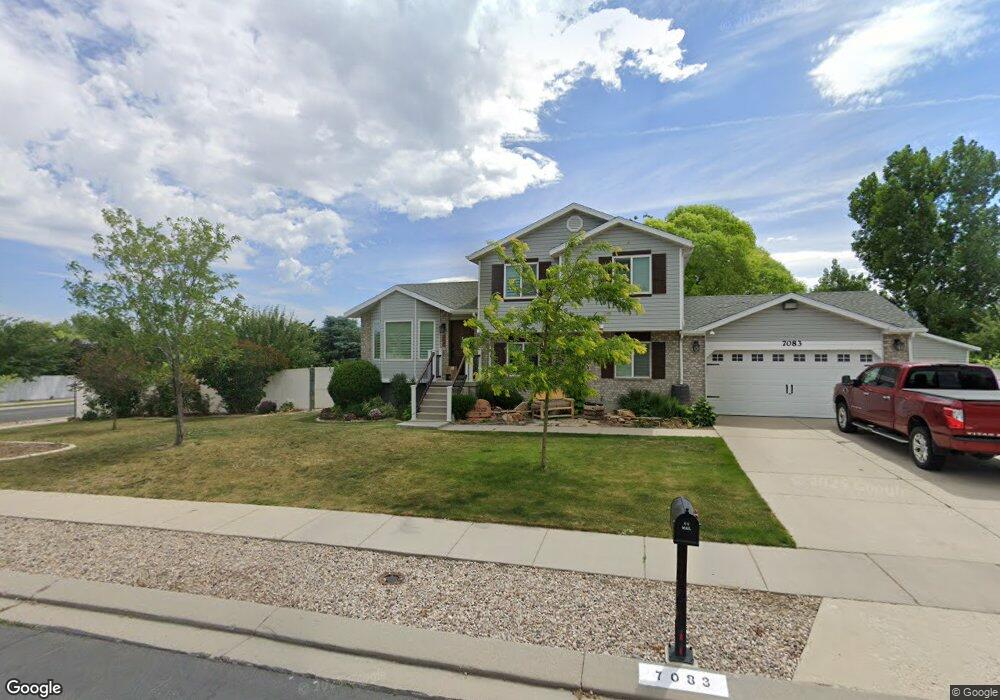
7083 Breeze Hill Rd West Jordan, UT 84081
Shadow Mountain NeighborhoodEstimated Value: $531,000 - $621,000
3
Beds
3
Baths
1,898
Sq Ft
$303/Sq Ft
Est. Value
About This Home
This home is located at 7083 Breeze Hill Rd, West Jordan, UT 84081 and is currently estimated at $575,604, approximately $303 per square foot. 7083 Breeze Hill Rd is a home located in Salt Lake County with nearby schools including Mountain Shadows School, West Hills Middle School, and Copper Hills High School.
Ownership History
Date
Name
Owned For
Owner Type
Purchase Details
Closed on
May 17, 2024
Sold by
Dixon Sean M and Dixon Kerry A
Bought by
Dansie David
Current Estimated Value
Home Financials for this Owner
Home Financials are based on the most recent Mortgage that was taken out on this home.
Original Mortgage
$215,000
Outstanding Balance
$211,951
Interest Rate
6.82%
Mortgage Type
New Conventional
Estimated Equity
$363,653
Purchase Details
Closed on
Jun 3, 2019
Sold by
Chidester Joseph and Chidester Casey
Bought by
Dixon Sean M and Dixon Kerry A
Home Financials for this Owner
Home Financials are based on the most recent Mortgage that was taken out on this home.
Original Mortgage
$368,207
Interest Rate
3.37%
Mortgage Type
FHA
Purchase Details
Closed on
Apr 14, 2011
Sold by
Cook Craig Stephen and Cook Catherine
Bought by
Chidester Joseph and Chidester Casey
Home Financials for this Owner
Home Financials are based on the most recent Mortgage that was taken out on this home.
Original Mortgage
$181,800
Interest Rate
4.83%
Mortgage Type
New Conventional
Purchase Details
Closed on
Dec 22, 2009
Sold by
Cook Craig Stephen
Bought by
Cook Craig Stephen and Cook Catherine
Home Financials for this Owner
Home Financials are based on the most recent Mortgage that was taken out on this home.
Original Mortgage
$116,900
Interest Rate
4.88%
Mortgage Type
New Conventional
Purchase Details
Closed on
Aug 20, 2004
Sold by
Francis Brandon
Bought by
Cook Craig Stephen
Home Financials for this Owner
Home Financials are based on the most recent Mortgage that was taken out on this home.
Original Mortgage
$150,900
Interest Rate
5.36%
Mortgage Type
Purchase Money Mortgage
Purchase Details
Closed on
Apr 14, 2003
Sold by
Centex Home Equity Co Llc
Bought by
Francis Brandon
Home Financials for this Owner
Home Financials are based on the most recent Mortgage that was taken out on this home.
Original Mortgage
$145,221
Interest Rate
5.6%
Mortgage Type
FHA
Purchase Details
Closed on
Oct 10, 2002
Sold by
Brinkman Michael L and Brinkman Dawn M
Bought by
Centex Home Equity Company Llc
Purchase Details
Closed on
Jul 2, 1997
Sold by
Reliance Homes Inc
Bought by
Brinkman Michael L and Brinkman Dawn M
Home Financials for this Owner
Home Financials are based on the most recent Mortgage that was taken out on this home.
Original Mortgage
$135,665
Interest Rate
7.92%
Mortgage Type
FHA
Create a Home Valuation Report for This Property
The Home Valuation Report is an in-depth analysis detailing your home's value as well as a comparison with similar homes in the area
Home Values in the Area
Average Home Value in this Area
Purchase History
| Date | Buyer | Sale Price | Title Company |
|---|---|---|---|
| Dansie David | -- | Ohana Title Insurance Agency | |
| Dixon Sean M | -- | Monument Title Ins Co | |
| Chidester Joseph | -- | Title One | |
| Cook Craig Stephen | -- | Landmark Title | |
| Cook Craig Stephen | -- | First American Title | |
| Francis Brandon | -- | First American Title | |
| Centex Home Equity Company Llc | $164,548 | -- | |
| Brinkman Michael L | -- | -- | |
| Reliance Homes Inc | -- | -- |
Source: Public Records
Mortgage History
| Date | Status | Borrower | Loan Amount |
|---|---|---|---|
| Open | Dansie David | $215,000 | |
| Previous Owner | Dixon Sean M | $368,207 | |
| Previous Owner | Chidester Joseph | $181,800 | |
| Previous Owner | Cook Craig Stephen | $116,900 | |
| Previous Owner | Cook Craig Stephen | $150,900 | |
| Previous Owner | Francis Brandon | $145,221 | |
| Previous Owner | Brinkman Michael L | $135,665 |
Source: Public Records
Tax History Compared to Growth
Tax History
| Year | Tax Paid | Tax Assessment Tax Assessment Total Assessment is a certain percentage of the fair market value that is determined by local assessors to be the total taxable value of land and additions on the property. | Land | Improvement |
|---|---|---|---|---|
| 2025 | $2,650 | $519,300 | $171,200 | $348,100 |
| 2024 | $2,650 | $509,800 | $164,600 | $345,200 |
| 2023 | $2,360 | $428,000 | $158,300 | $269,700 |
| 2022 | $2,447 | $436,600 | $155,200 | $281,400 |
| 2021 | $2,168 | $352,000 | $119,400 | $232,600 |
| 2020 | $2,043 | $311,300 | $109,800 | $201,500 |
| 2019 | $1,977 | $295,500 | $103,600 | $191,900 |
| 2018 | $1,817 | $269,300 | $103,600 | $165,700 |
| 2017 | $1,760 | $259,800 | $103,600 | $156,200 |
| 2016 | $1,579 | $219,000 | $108,800 | $110,200 |
| 2015 | $1,680 | $227,100 | $116,500 | $110,600 |
| 2014 | $1,642 | $218,600 | $112,800 | $105,800 |
Source: Public Records
Map
Nearby Homes
- 6928 Beargrass Rd
- 7232 W Terraine Rd
- 7238 W Terraine Rd
- 7246 W Terraine Rd
- 5151 Case Mountain Rd
- 4888 Ticklegrass Rd
- 5208 W Case Mountain Rd
- 4891 Calyx Cir
- 7071 S Kristilyn Ln
- 6880 S Survey Peak Ln
- 6884 S Survey Peak Ln
- 6888 S Survey Peak Ln
- 4983 Shooting Star Ave
- 7138 S Brittany Town Dr
- 7173 S Kristilyn Ln
- 4785 Foggio Ct
- 4763 W Arno Way
- 7043 Orion Hill Rd
- 6900 S Florentine Way
- 7043 S Orion Hill Rd
- 7083 S Breeze Hill Rd
- 7084 Winter Hill Cove
- 7097 S Breeze Hill Rd
- 7097 Breeze Hill Rd
- 7094 Winter Hill Cove
- 7086 S Aerie Hill Dr
- 7086 S Breeze Hill Rd
- 7086 Breeze Hill Rd
- 7072 Breeze Hill Rd
- 7059 Breeze Hill Rd
- 7059 S Breeze Hill Rd
- 4962 W Winter Hill Ln
- 4962 Winter Hill Ln
- 7113 Breeze Hill Rd
- 4962 W 7070 S
- 7102 S Breeze Hill Rd
- 7102 Breeze Hill Rd
- 7106 Winter Hill Cove
- 7058 Breeze Hill Rd
- 4948 Winter Hill Ln