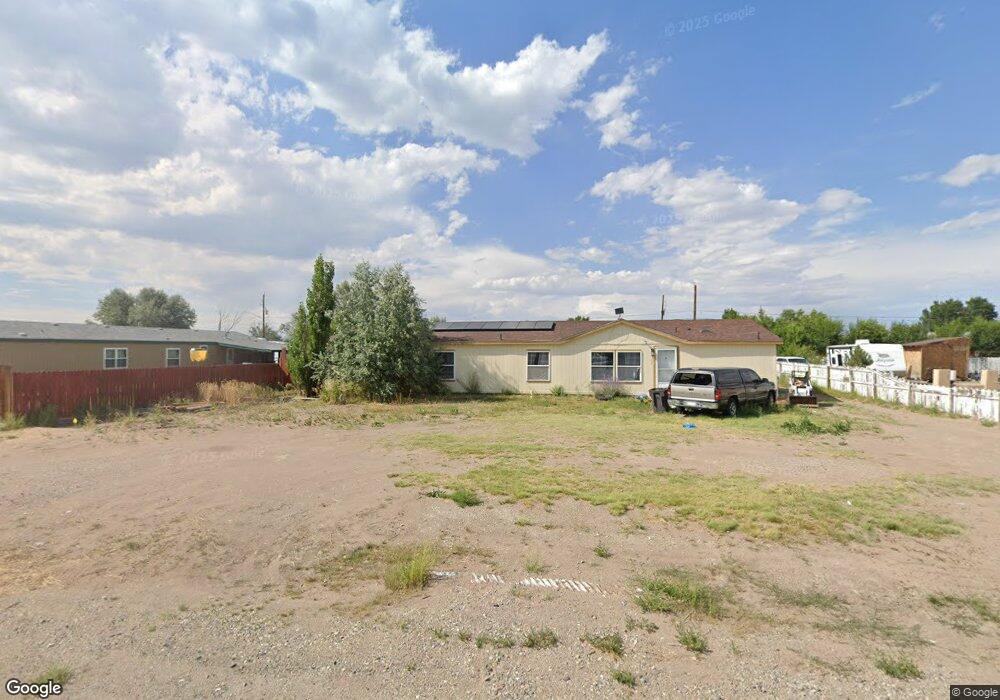
709 20th St Alamosa, CO 81101
Estimated Value: $333,000 - $378,000
4
Beds
3
Baths
2,475
Sq Ft
$142/Sq Ft
Est. Value
About This Home
This home is located at 709 20th St, Alamosa, CO 81101 and is currently estimated at $352,000, approximately $142 per square foot. 709 20th St is a home located in Alamosa County with nearby schools including Alamosa Elementary School, Ortega Middle School, and Alamosa High School.
Ownership History
Date
Name
Owned For
Owner Type
Purchase Details
Closed on
Nov 5, 2013
Sold by
Gallegos Angelica
Bought by
Gallegos Troy W
Current Estimated Value
Home Financials for this Owner
Home Financials are based on the most recent Mortgage that was taken out on this home.
Original Mortgage
$94,500
Outstanding Balance
$70,863
Interest Rate
4.37%
Mortgage Type
New Conventional
Estimated Equity
$281,137
Purchase Details
Closed on
Feb 22, 2008
Sold by
Duran Ventura and Duran Dawndee
Bought by
Gallegos Troy W and Gallegos Angelica
Home Financials for this Owner
Home Financials are based on the most recent Mortgage that was taken out on this home.
Original Mortgage
$190,000
Outstanding Balance
$117,444
Interest Rate
5.68%
Mortgage Type
New Conventional
Estimated Equity
$234,556
Purchase Details
Closed on
Sep 25, 2006
Sold by
Duran Ventura and Vigil Dawndee
Bought by
Duran Ventura and Duran Dawndee
Purchase Details
Closed on
Mar 16, 2001
Sold by
Johnson Mike
Bought by
Duran Ventura and Vigil Dawndee
Purchase Details
Closed on
Jul 28, 1999
Sold by
Poulson Monti
Bought by
Johnson Mike
Purchase Details
Closed on
Jun 9, 1998
Sold by
Fink John B Jr & Dorothy M Trustees
Bought by
Poulson Monti
Create a Home Valuation Report for This Property
The Home Valuation Report is an in-depth analysis detailing your home's value as well as a comparison with similar homes in the area
Home Values in the Area
Average Home Value in this Area
Purchase History
| Date | Buyer | Sale Price | Title Company |
|---|---|---|---|
| Gallegos Troy W | -- | None Available | |
| Gallegos Troy W | $142,000 | None Available | |
| Duran Ventura | -- | None Available | |
| Duran Ventura | $14,000 | -- | |
| Johnson Mike | $20,000 | -- | |
| Poulson Monti | $77,000 | -- |
Source: Public Records
Mortgage History
| Date | Status | Borrower | Loan Amount |
|---|---|---|---|
| Open | Gallegos Troy W | $94,500 | |
| Open | Gallegos Troy W | $190,000 |
Source: Public Records
Tax History Compared to Growth
Tax History
| Year | Tax Paid | Tax Assessment Tax Assessment Total Assessment is a certain percentage of the fair market value that is determined by local assessors to be the total taxable value of land and additions on the property. | Land | Improvement |
|---|---|---|---|---|
| 2024 | $1,326 | $21,622 | $1,675 | $19,947 |
| 2023 | $1,359 | $21,831 | $1,691 | $20,140 |
| 2022 | $1,259 | $16,374 | $1,001 | $15,373 |
| 2021 | $1,295 | $16,374 | $1,001 | $15,373 |
| 2020 | $1,116 | $16,374 | $1,001 | $15,373 |
| 2019 | $1,326 | $13,868 | $1,001 | $12,867 |
| 2018 | $1,096 | $13,338 | $1,008 | $12,330 |
| 2017 | $1,098 | $13,338 | $1,008 | $12,330 |
| 2016 | $1,180 | $14,403 | $1,114 | $13,289 |
| 2015 | $1,179 | $14,403 | $1,114 | $13,289 |
| 2014 | -- | $14,752 | $1,114 | $13,638 |
| 2013 | -- | $14,752 | $1,114 | $13,638 |
Source: Public Records
Map
Nearby Homes
- 1911 Edison Ave
- 1731 San Juan Ave
- 2416 Commerce Cir
- 1704 Ross Ave
- TBD Commerce Cir
- 1306 State Ave
- 807 13th St
- 1201 San Juan Ave
- 1121 San Juan Ave
- 814 10th St
- 1002 Edison Ave
- 8719 Us Highway 285 S Unit B9
- 0 Tbd Unit 5544149
- 0 Tbd Unit 9319620
- 0 Tbd Unit 3736444
- 0 Tbd Unit 8786377
- 0 Tbd Unit 4975904
- 0 Tbd Unit 4403932
- 0 Tbd Unit 7821426
- 8581 Road 8 S
- 1930 Edison Ave
- 705 20th St
- 1920 Edison Ave
- 1931 San Juan Ave
- 1941 San Juan Ave
- 1921 San Juan Ave
- 1910 Edison Ave
- 1911 San Juan Ave
- 1925 Edison Ave
- 1900 Edison Ave
- 1921 Edison Ave
- 1901 San Juan Ave
- 805 20th St
- 1907 Edison Ave
- 609 20th St
- 1860 Edison Ave
- 1861 San Juan Ave
- 1905 Edison Ave
- 809 20th St
- 1850 Edison Ave