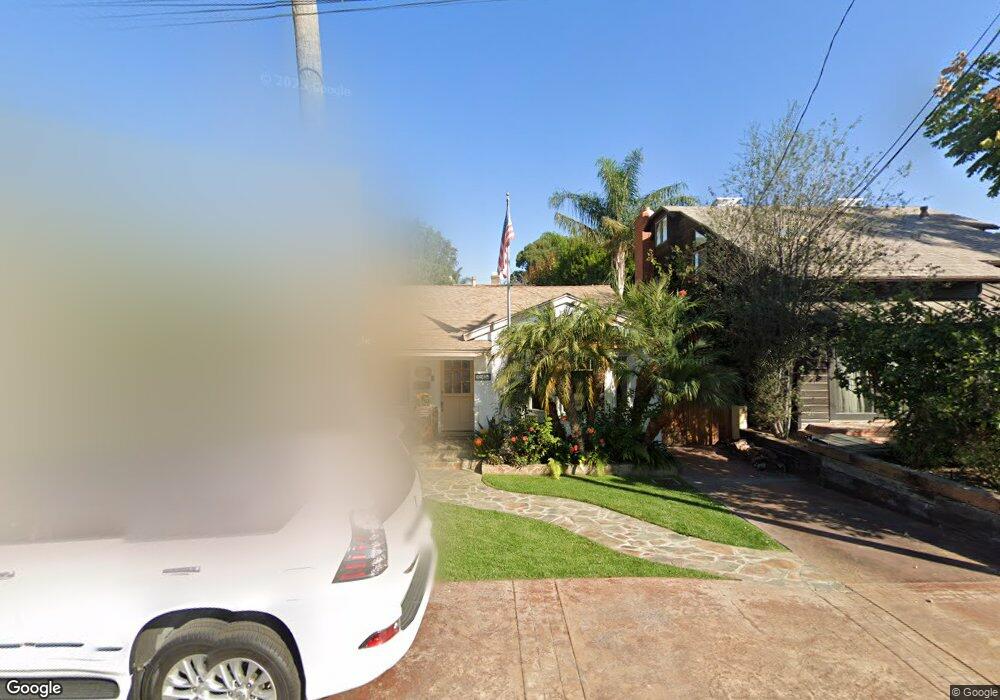
709 29th St Manhattan Beach, CA 90266
Estimated Value: $2,417,651 - $3,449,000
4
Beds
2
Baths
1,936
Sq Ft
$1,542/Sq Ft
Est. Value
About This Home
This home is located at 709 29th St, Manhattan Beach, CA 90266 and is currently estimated at $2,984,663, approximately $1,541 per square foot. 709 29th St is a home located in Los Angeles County with nearby schools including Grand View Elementary School, Manhattan Beach Middle School, and Mira Costa High School.
Ownership History
Date
Name
Owned For
Owner Type
Purchase Details
Closed on
Apr 30, 2018
Sold by
Lysle William E
Bought by
Lysle William E and Lysle Christine D
Current Estimated Value
Home Financials for this Owner
Home Financials are based on the most recent Mortgage that was taken out on this home.
Original Mortgage
$250,000
Interest Rate
4.4%
Mortgage Type
Credit Line Revolving
Purchase Details
Closed on
Feb 6, 2013
Sold by
Lysle William E
Bought by
Lysle William E and Donahue Christine
Purchase Details
Closed on
Jul 20, 2000
Sold by
Lysle William E
Bought by
Lysle William E and William E Lysle Trust
Create a Home Valuation Report for This Property
The Home Valuation Report is an in-depth analysis detailing your home's value as well as a comparison with similar homes in the area
Home Values in the Area
Average Home Value in this Area
Purchase History
| Date | Buyer | Sale Price | Title Company |
|---|---|---|---|
| Lysle William E | -- | Old Republic Title Company | |
| Lysle William E | -- | None Available | |
| Lysle William E | -- | -- |
Source: Public Records
Mortgage History
| Date | Status | Borrower | Loan Amount |
|---|---|---|---|
| Closed | Lysle William E | $250,000 |
Source: Public Records
Tax History Compared to Growth
Tax History
| Year | Tax Paid | Tax Assessment Tax Assessment Total Assessment is a certain percentage of the fair market value that is determined by local assessors to be the total taxable value of land and additions on the property. | Land | Improvement |
|---|---|---|---|---|
| 2025 | $5,040 | $406,440 | $262,033 | $144,407 |
| 2024 | $5,040 | $398,472 | $256,896 | $141,576 |
| 2023 | $4,845 | $390,659 | $251,859 | $138,800 |
| 2022 | $4,768 | $383,000 | $246,921 | $136,079 |
| 2021 | $4,735 | $375,491 | $242,080 | $133,411 |
| 2019 | $4,616 | $364,355 | $234,900 | $129,455 |
| 2018 | $4,484 | $357,212 | $230,295 | $126,917 |
| 2016 | $3,988 | $343,343 | $221,353 | $121,990 |
| 2015 | $3,908 | $338,187 | $218,029 | $120,158 |
| 2014 | $3,864 | $331,564 | $213,759 | $117,805 |
Source: Public Records
Map
Nearby Homes