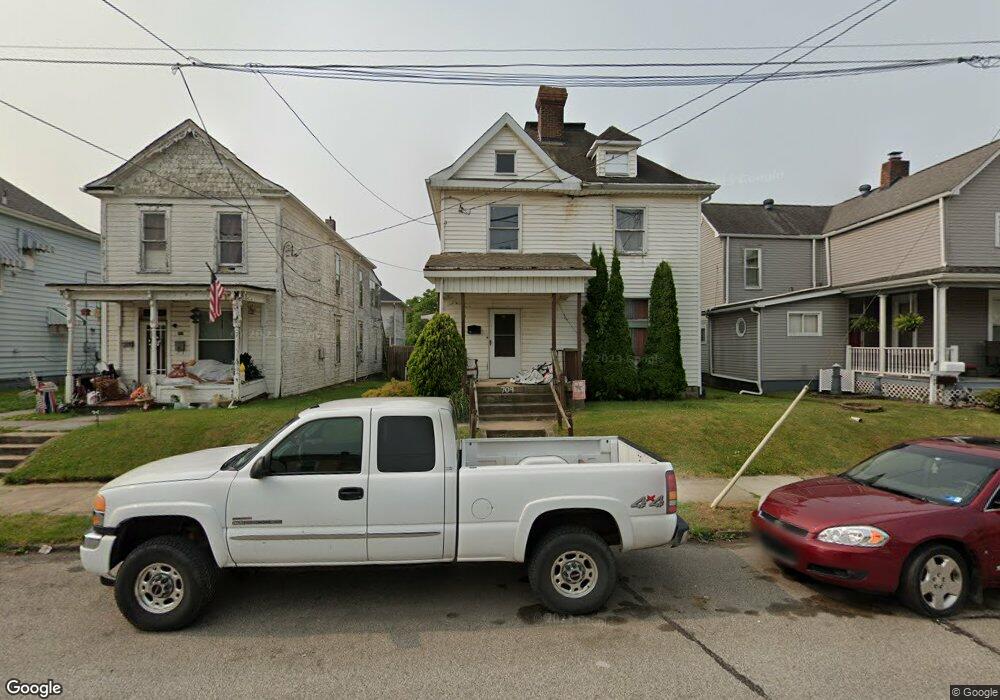
709 2nd St Moundsville, WV 26041
Estimated Value: $50,000 - $128,000
4
Beds
2
Baths
2,750
Sq Ft
$37/Sq Ft
Est. Value
About This Home
This home is located at 709 2nd St, Moundsville, WV 26041 and is currently estimated at $101,050, approximately $36 per square foot. 709 2nd St is a home located in Marshall County with nearby schools including St. Francis Xavier School and Moundsville Christian School.
Ownership History
Date
Name
Owned For
Owner Type
Purchase Details
Closed on
Dec 4, 2013
Sold by
Hsbc Mortgage Services Inc
Bought by
Walker James and Walker Crystal
Current Estimated Value
Purchase Details
Closed on
Jun 11, 2013
Sold by
Day David W and Day Jamie L
Bought by
Hsbc Mortgage Services Inc
Purchase Details
Closed on
May 10, 2006
Sold by
Department Of Veterans Affairs
Bought by
Day David W and Day Jamie L
Home Financials for this Owner
Home Financials are based on the most recent Mortgage that was taken out on this home.
Original Mortgage
$50,825
Interest Rate
6.62%
Mortgage Type
New Conventional
Create a Home Valuation Report for This Property
The Home Valuation Report is an in-depth analysis detailing your home's value as well as a comparison with similar homes in the area
Home Values in the Area
Average Home Value in this Area
Purchase History
| Date | Buyer | Sale Price | Title Company |
|---|---|---|---|
| Walker James | $25,000 | None Available | |
| Hsbc Mortgage Services Inc | $35,206 | None Available | |
| Day David W | -- | Eagle Title Agency |
Source: Public Records
Mortgage History
| Date | Status | Borrower | Loan Amount |
|---|---|---|---|
| Previous Owner | Day David W | $50,825 |
Source: Public Records
Tax History Compared to Growth
Tax History
| Year | Tax Paid | Tax Assessment Tax Assessment Total Assessment is a certain percentage of the fair market value that is determined by local assessors to be the total taxable value of land and additions on the property. | Land | Improvement |
|---|---|---|---|---|
| 2025 | $354 | $28,500 | $5,460 | $23,040 |
| 2024 | $354 | $27,720 | $5,460 | $22,260 |
| 2023 | $344 | $27,720 | $5,460 | $22,260 |
| 2022 | $351 | $27,720 | $5,460 | $22,260 |
| 2021 | $346 | $27,720 | $5,460 | $22,260 |
| 2020 | $330 | $26,220 | $5,460 | $20,760 |
| 2019 | $320 | $25,260 | $5,460 | $19,800 |
| 2018 | $322 | $25,380 | $5,460 | $19,920 |
| 2017 | $319 | $24,540 | $5,460 | $19,080 |
| 2016 | $306 | $24,060 | $5,460 | $18,600 |
| 2015 | $284 | $22,080 | $4,980 | $17,100 |
| 2014 | $438 | $33,360 | $5,280 | $28,080 |
Source: Public Records
Map
Nearby Homes