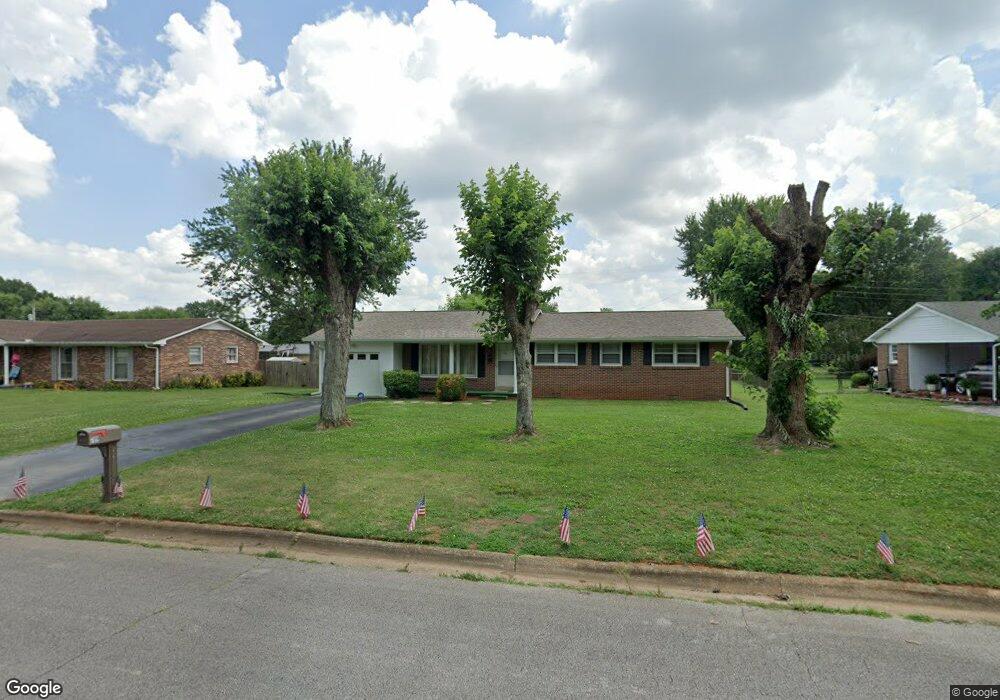
709 6th St Lawrenceburg, TN 38464
Estimated Value: $184,396 - $243,000
--
Bed
2
Baths
1,354
Sq Ft
$163/Sq Ft
Est. Value
About This Home
This home is located at 709 6th St, Lawrenceburg, TN 38464 and is currently estimated at $221,349, approximately $163 per square foot. 709 6th St is a home located in Lawrence County with nearby schools including Ingram Sowell Elementary School, Lawrenceburg Public Elementary School, and David Crockett Elementary School.
Ownership History
Date
Name
Owned For
Owner Type
Purchase Details
Closed on
Oct 13, 2008
Sold by
Lopp Cleo O
Bought by
Lopp Donald Ray
Current Estimated Value
Purchase Details
Closed on
Oct 26, 2004
Sold by
Yvonne Faulkenberry
Bought by
Ray Lopp Donald
Home Financials for this Owner
Home Financials are based on the most recent Mortgage that was taken out on this home.
Original Mortgage
$46,852
Interest Rate
5.62%
Purchase Details
Closed on
Dec 15, 1994
Sold by
Emery Lopp
Bought by
Etal Lopp Donald Ray
Purchase Details
Closed on
Jan 5, 1977
Bought by
Lopp Emery and Lopp Cleo
Create a Home Valuation Report for This Property
The Home Valuation Report is an in-depth analysis detailing your home's value as well as a comparison with similar homes in the area
Home Values in the Area
Average Home Value in this Area
Purchase History
| Date | Buyer | Sale Price | Title Company |
|---|---|---|---|
| Lopp Donald Ray | -- | -- | |
| Ray Lopp Donald | $44,000 | -- | |
| Etal Lopp Donald Ray | $28,500 | -- | |
| Lopp Emery | -- | -- |
Source: Public Records
Mortgage History
| Date | Status | Borrower | Loan Amount |
|---|---|---|---|
| Previous Owner | Lopp Emery | $46,852 |
Source: Public Records
Tax History Compared to Growth
Tax History
| Year | Tax Paid | Tax Assessment Tax Assessment Total Assessment is a certain percentage of the fair market value that is determined by local assessors to be the total taxable value of land and additions on the property. | Land | Improvement |
|---|---|---|---|---|
| 2025 | $1,046 | $33,650 | $0 | $0 |
| 2024 | $1,046 | $33,650 | $3,750 | $29,900 |
| 2023 | $1,046 | $33,650 | $3,750 | $29,900 |
| 2022 | $1,046 | $33,650 | $3,750 | $29,900 |
| 2021 | $865 | $19,675 | $2,500 | $17,175 |
| 2020 | $865 | $19,675 | $2,500 | $17,175 |
| 2019 | $865 | $19,675 | $2,500 | $17,175 |
| 2018 | $865 | $19,675 | $2,500 | $17,175 |
| 2017 | $865 | $19,675 | $2,500 | $17,175 |
| 2016 | $865 | $19,675 | $2,500 | $17,175 |
| 2015 | $819 | $19,675 | $2,500 | $17,175 |
| 2014 | $789 | $18,950 | $2,500 | $16,450 |
Source: Public Records
Map
Nearby Homes