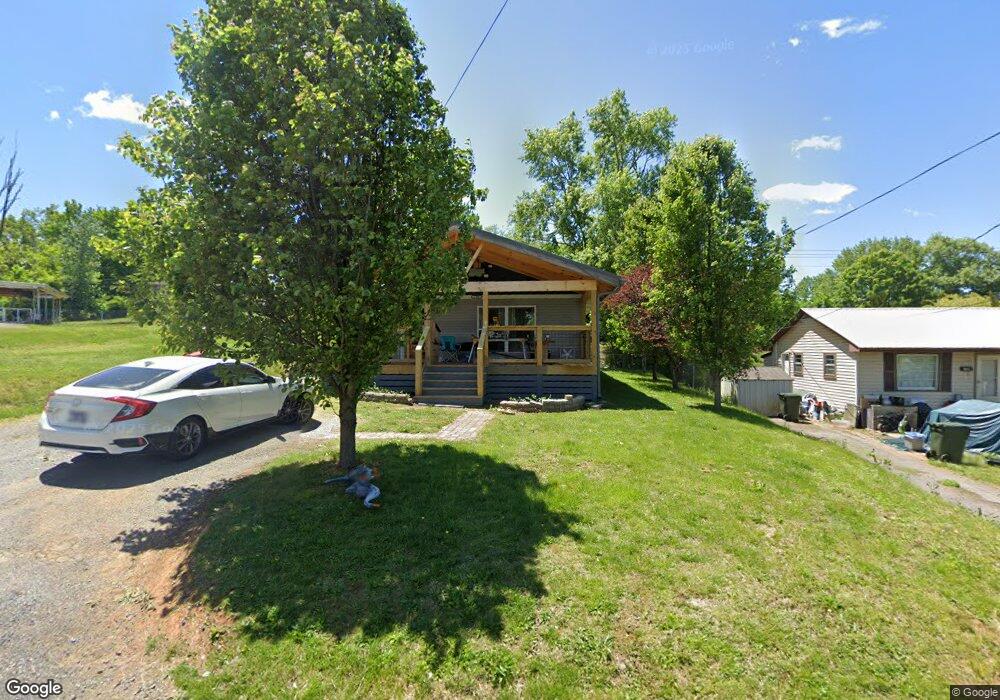
709 7th St Newport, TN 37821
Estimated Value: $130,414 - $203,000
--
Bed
1
Bath
1,161
Sq Ft
$140/Sq Ft
Est. Value
About This Home
This home is located at 709 7th St, Newport, TN 37821 and is currently estimated at $162,854, approximately $140 per square foot. 709 7th St is a home located in Cocke County with nearby schools including Newport Grammar School, Grace Christian School, and Calvary Baptist Tabernacle School.
Ownership History
Date
Name
Owned For
Owner Type
Purchase Details
Closed on
Apr 12, 2005
Sold by
Blazer Donnie
Bought by
Johnson Michael D
Current Estimated Value
Home Financials for this Owner
Home Financials are based on the most recent Mortgage that was taken out on this home.
Original Mortgage
$14,580
Interest Rate
5.79%
Mortgage Type
Cash
Purchase Details
Closed on
Oct 1, 2004
Sold by
Wallin Joseph A
Bought by
Blazer Donnie
Purchase Details
Closed on
Apr 22, 1992
Bought by
Wallin Joseph A Tadd
Create a Home Valuation Report for This Property
The Home Valuation Report is an in-depth analysis detailing your home's value as well as a comparison with similar homes in the area
Home Values in the Area
Average Home Value in this Area
Purchase History
| Date | Buyer | Sale Price | Title Company |
|---|---|---|---|
| Johnson Michael D | $73,400 | -- | |
| Blazer Donnie | $35,000 | -- | |
| Wallin Joseph A Tadd | $27,000 | -- |
Source: Public Records
Mortgage History
| Date | Status | Borrower | Loan Amount |
|---|---|---|---|
| Closed | Wallin Joseph A Tadd | $14,580 | |
| Closed | Wallin Joseph A Tadd | $0 |
Source: Public Records
Tax History Compared to Growth
Tax History
| Year | Tax Paid | Tax Assessment Tax Assessment Total Assessment is a certain percentage of the fair market value that is determined by local assessors to be the total taxable value of land and additions on the property. | Land | Improvement |
|---|---|---|---|---|
| 2024 | $543 | $21,200 | $4,700 | $16,500 |
| 2023 | $543 | $21,200 | $4,700 | $16,500 |
| 2022 | $1,032 | $20,725 | $4,700 | $16,025 |
| 2021 | $1,032 | $20,725 | $4,700 | $16,025 |
| 2020 | $1,032 | $20,725 | $4,700 | $16,025 |
| 2019 | $950 | $17,375 | $5,150 | $12,225 |
| 2018 | $950 | $17,375 | $5,150 | $12,225 |
| 2017 | $1,006 | $17,375 | $5,150 | $12,225 |
| 2016 | $952 | $17,375 | $5,150 | $12,225 |
| 2015 | $790 | $17,375 | $5,150 | $12,225 |
| 2014 | $790 | $19,925 | $5,725 | $14,200 |
| 2013 | $790 | $19,050 | $3,175 | $15,875 |
Source: Public Records
Map
Nearby Homes