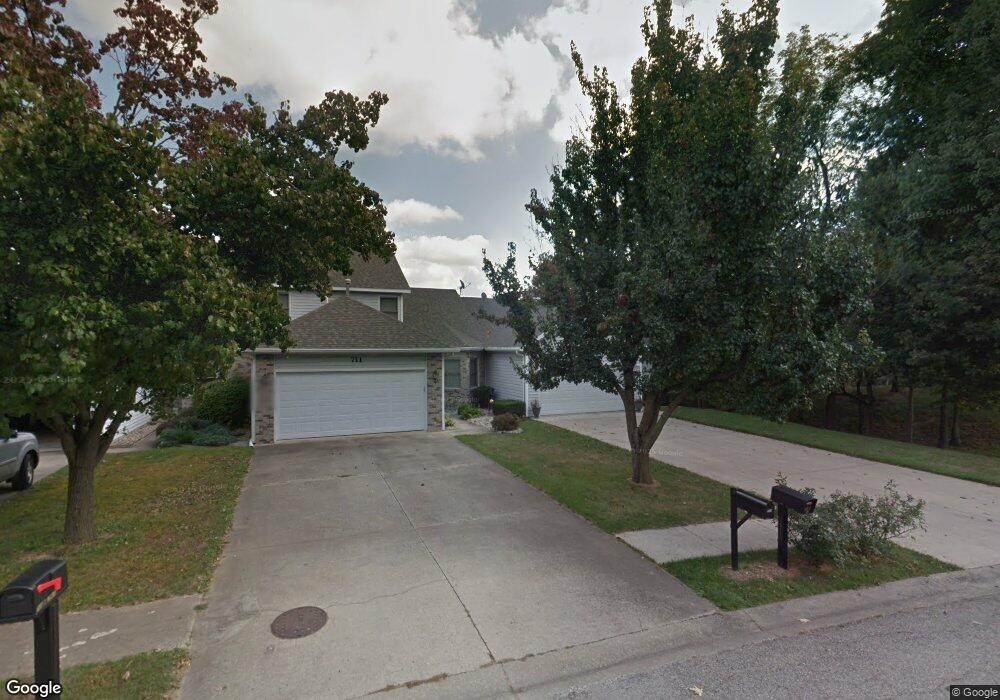
709 Bent Tree Dr Effingham, IL 62401
Estimated Value: $226,000 - $309,000
4
Beds
3
Baths
1,369
Sq Ft
$195/Sq Ft
Est. Value
About This Home
This home is located at 709 Bent Tree Dr, Effingham, IL 62401 and is currently estimated at $266,285, approximately $194 per square foot. 709 Bent Tree Dr is a home located in Effingham County with nearby schools including South Side Grade School, Early Learning Center, and Central Grade School.
Ownership History
Date
Name
Owned For
Owner Type
Purchase Details
Closed on
Nov 1, 2017
Sold by
Yager Michael D
Bought by
Golladay William G and Golladay Beverly A
Current Estimated Value
Purchase Details
Closed on
Jul 18, 2016
Sold by
Baker Michael L and Harder Baker Sara L
Bought by
Yager Michael D and Yager Elizabeth E
Home Financials for this Owner
Home Financials are based on the most recent Mortgage that was taken out on this home.
Original Mortgage
$42,075
Interest Rate
3.66%
Mortgage Type
Future Advance Clause Open End Mortgage
Purchase Details
Closed on
Feb 28, 2013
Sold by
Huelskoetter Delbert G and Marita Ann Huelskoetter Trust
Bought by
Yager Michael D
Home Financials for this Owner
Home Financials are based on the most recent Mortgage that was taken out on this home.
Original Mortgage
$131,200
Interest Rate
3.34%
Mortgage Type
New Conventional
Purchase Details
Closed on
Aug 2, 2010
Sold by
Mitchell Russell H and Mitchell Phyllis L
Bought by
Mitchell Russell H and Mitchell Phyllis L
Create a Home Valuation Report for This Property
The Home Valuation Report is an in-depth analysis detailing your home's value as well as a comparison with similar homes in the area
Home Values in the Area
Average Home Value in this Area
Purchase History
| Date | Buyer | Sale Price | Title Company |
|---|---|---|---|
| Golladay William G | $199,000 | American Title Gurantay | |
| Yager Michael D | $49,500 | Attorney | |
| Yager Michael D | $164,000 | None Available | |
| Mitchell Russell H | -- | None Available |
Source: Public Records
Mortgage History
| Date | Status | Borrower | Loan Amount |
|---|---|---|---|
| Previous Owner | Yager Michael D | $42,075 | |
| Previous Owner | Yager Michael D | $131,200 |
Source: Public Records
Tax History Compared to Growth
Tax History
| Year | Tax Paid | Tax Assessment Tax Assessment Total Assessment is a certain percentage of the fair market value that is determined by local assessors to be the total taxable value of land and additions on the property. | Land | Improvement |
|---|---|---|---|---|
| 2024 | $4,552 | $78,380 | $19,420 | $58,960 |
| 2023 | $4,102 | $71,250 | $17,650 | $53,600 |
| 2022 | $3,799 | $65,360 | $16,190 | $49,170 |
| 2021 | $3,896 | $64,710 | $16,030 | $48,680 |
| 2020 | $3,757 | $62,890 | $15,580 | $47,310 |
| 2019 | $3,723 | $62,270 | $15,430 | $46,840 |
| 2018 | $3,572 | $59,880 | $14,840 | $45,040 |
| 2017 | $3,495 | $58,710 | $14,550 | $44,160 |
| 2016 | $3,768 | $57,000 | $14,130 | $42,870 |
| 2015 | -- | $55,340 | $13,720 | $41,620 |
| 2014 | -- | $53,730 | $13,320 | $40,410 |
| 2013 | -- | $52,680 | $13,060 | $39,620 |
| 2012 | -- | $51,900 | $12,870 | $39,030 |
Source: Public Records
Map
Nearby Homes
- 0 Cardinal Dr
- 1025 Cardinal Dr
- 506 Bent Tree Dr
- 702 E North Ave
- 805 N Glenwood St
- 907 N Ealy St
- 711 N Cleveland St
- 300 Flamingo Ave
- 1105 N Merchant St
- 603 E Saint Louis Ave
- 505 W Evergreen Ave
- 410 Illinois Ave
- 412 Illinois Ave
- 411 Illinois Ave
- 406 W Kentucky Ave
- 104 S Willow St
- 0 Althoff Dr
- 809 Flamingo Ave
- 800 E Rickelman Ave
- 1001 E Gordon Ave
- 711 Bent Tree Dr
- 713 Bent Tree Dr
- 705 Bent Tree Dr
- 0 E Evergreen Ave
- 708 Bent Tree Dr
- 708 Bent Tree Dr
- 708 Bent Tree Dr
- 708 E Evergreen Ave
- 703 Bent Tree Dr
- 1004 Sherwood Park
- 1006 Sherwood Park
- 1002 Sherwood Park
- 1008 Sherwood Park
- 1021 Cardinal Dr
- 706 E Evergreen Ave
- 1019 Cardinal Dr
- 701 Bent Tree Dr
- 1013 Cardinal Dr
- 704 E Evergreen Ave
- 1011 Cardinal Dr