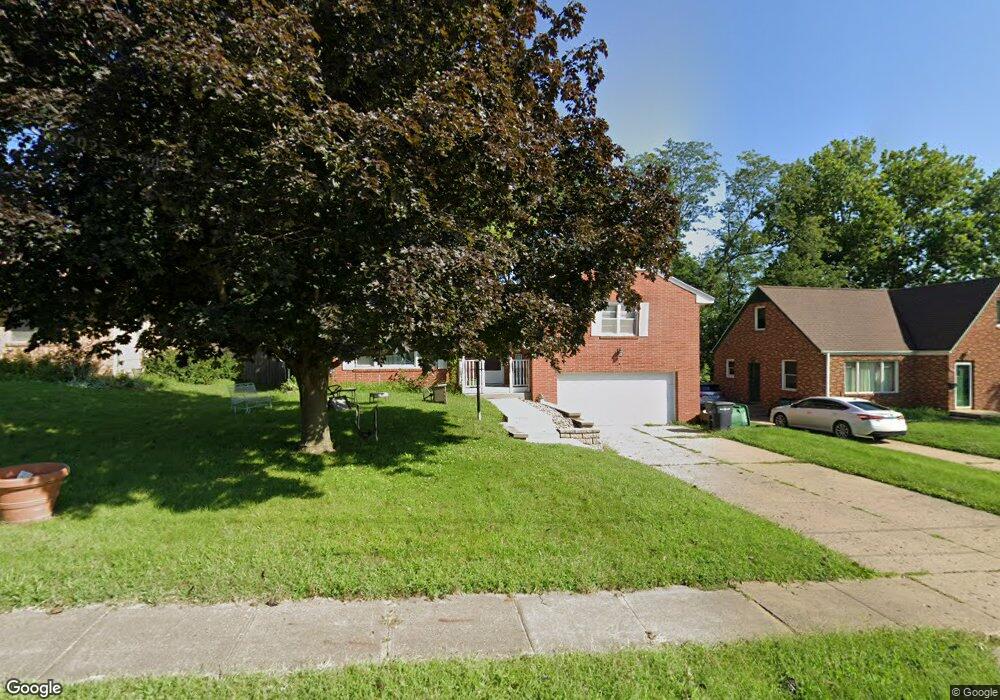
709 Clegg Rd West Des Moines, IA 50265
Estimated Value: $262,000 - $283,000
3
Beds
2
Baths
1,552
Sq Ft
$176/Sq Ft
Est. Value
About This Home
This home is located at 709 Clegg Rd, West Des Moines, IA 50265 and is currently estimated at $272,497, approximately $175 per square foot. 709 Clegg Rd is a home located in Polk County with nearby schools including Hillside Elementary School, Stilwell Junior High School, and Valley Southwoods Freshman High School.
Ownership History
Date
Name
Owned For
Owner Type
Purchase Details
Closed on
Aug 25, 2003
Sold by
Thompson Michael J and Thompson Janet M
Bought by
Carlson Steven W and Carlson Donna Leann
Current Estimated Value
Home Financials for this Owner
Home Financials are based on the most recent Mortgage that was taken out on this home.
Original Mortgage
$123,500
Outstanding Balance
$52,917
Interest Rate
5.25%
Mortgage Type
Purchase Money Mortgage
Estimated Equity
$219,580
Create a Home Valuation Report for This Property
The Home Valuation Report is an in-depth analysis detailing your home's value as well as a comparison with similar homes in the area
Home Values in the Area
Average Home Value in this Area
Purchase History
| Date | Buyer | Sale Price | Title Company |
|---|---|---|---|
| Carlson Steven W | $129,500 | -- |
Source: Public Records
Mortgage History
| Date | Status | Borrower | Loan Amount |
|---|---|---|---|
| Open | Carlson Steven W | $123,500 |
Source: Public Records
Tax History Compared to Growth
Tax History
| Year | Tax Paid | Tax Assessment Tax Assessment Total Assessment is a certain percentage of the fair market value that is determined by local assessors to be the total taxable value of land and additions on the property. | Land | Improvement |
|---|---|---|---|---|
| 2025 | $3,510 | $253,500 | $67,600 | $185,900 |
| 2024 | $3,510 | $231,900 | $60,900 | $171,000 |
| 2023 | $3,600 | $231,900 | $60,900 | $171,000 |
| 2022 | $3,556 | $195,300 | $52,700 | $142,600 |
| 2021 | $3,382 | $195,300 | $52,700 | $142,600 |
| 2020 | $3,326 | $177,200 | $47,800 | $129,400 |
| 2019 | $3,076 | $177,200 | $47,800 | $129,400 |
| 2018 | $3,080 | $158,700 | $42,500 | $116,200 |
| 2017 | $3,064 | $158,700 | $42,500 | $116,200 |
| 2016 | $2,994 | $153,500 | $39,100 | $114,400 |
| 2015 | $2,994 | $153,500 | $39,100 | $114,400 |
| 2014 | $2,948 | $154,300 | $38,500 | $115,800 |
Source: Public Records
Map
Nearby Homes
- 705 Clegg Rd
- 711 Clegg Rd
- 701 Clegg Rd
- 717 Clegg Rd
- 1146 7th St
- 721 Clegg Rd
- 1237 8th St Unit ID1036848P
- 1231 8th St Unit ID1036848P
- 1231 8th St
- 1243 8th St Unit ID1036772P
- 629 Clegg Rd
- 1245 8th St Unit ID1036841P
- 1249 8th St Unit ID1036841P
- 1147 7th St
- 1247 8th St Unit ID1036772P
- 716 Clegg Rd
- 1140 7th St
- 1129 8th St
- 630 Clegg Rd