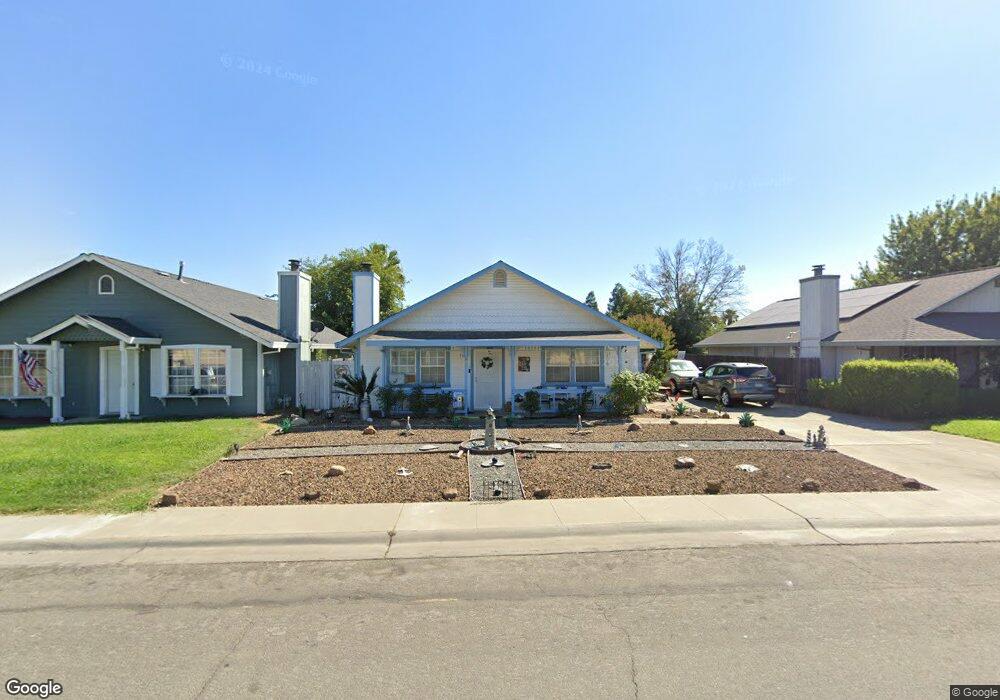
709 Date St Orland, CA 95963
Estimated Value: $322,181 - $421,000
3
Beds
2
Baths
1,344
Sq Ft
$277/Sq Ft
Est. Value
About This Home
This home is located at 709 Date St, Orland, CA 95963 and is currently estimated at $371,795, approximately $276 per square foot. 709 Date St is a home located in Glenn County with nearby schools including Mill Street Elementary School, Fairview Elementary School, and Price Intermediate School.
Ownership History
Date
Name
Owned For
Owner Type
Purchase Details
Closed on
Feb 18, 2004
Sold by
Olson Marie B and Olson James E
Bought by
Johnson Jens C and Johnson Linda S
Current Estimated Value
Home Financials for this Owner
Home Financials are based on the most recent Mortgage that was taken out on this home.
Original Mortgage
$162,000
Outstanding Balance
$76,083
Interest Rate
5.85%
Mortgage Type
Unknown
Estimated Equity
$295,712
Create a Home Valuation Report for This Property
The Home Valuation Report is an in-depth analysis detailing your home's value as well as a comparison with similar homes in the area
Purchase History
| Date | Buyer | Sale Price | Title Company |
|---|---|---|---|
| Johnson Jens C | $155,000 | Glenn County Title Co |
Source: Public Records
Mortgage History
| Date | Status | Borrower | Loan Amount |
|---|---|---|---|
| Open | Johnson Jens C | $162,000 |
Source: Public Records
Tax History
| Year | Tax Paid | Tax Assessment Tax Assessment Total Assessment is a certain percentage of the fair market value that is determined by local assessors to be the total taxable value of land and additions on the property. | Land | Improvement |
|---|---|---|---|---|
| 2025 | $2,342 | $220,372 | $45,495 | $174,877 |
| 2024 | $2,342 | $216,052 | $44,603 | $171,449 |
| 2023 | $2,291 | $211,817 | $43,729 | $168,088 |
| 2022 | $2,247 | $207,665 | $42,872 | $164,793 |
| 2021 | $2,226 | $203,594 | $42,032 | $161,562 |
| 2020 | $2,074 | $188,027 | $44,963 | $143,064 |
| 2019 | $1,907 | $170,935 | $40,876 | $130,059 |
| 2018 | $1,698 | $159,753 | $38,202 | $121,551 |
| 2017 | $1,710 | $152,146 | $36,383 | $115,763 |
| 2016 | $1,559 | $144,900 | $34,650 | $110,250 |
| 2015 | -- | $138,000 | $33,000 | $105,000 |
| 2014 | $1,410 | $131,250 | $31,500 | $99,750 |
Source: Public Records
Map
Nearby Homes
- 737 Lynn Dr
- 782 Jacquelyn Dr
- 634 Salomon Dr
- 906 Almond Way
- 1019 W Monterey St
- 0 Hoff Way
- 1158 Hoff Way
- 100 Frances Ln
- 736 8th St
- 6400 County Road Hh
- 4426 Commerce Ln
- 303 Colusa St
- 929 3rd St
- 810 East St
- 65 E Colusa St
- 919 East St
- 325 Byron Way
- 246 E Shasta St
- 329 Byron Way
- 0 South St Unit SN23178337
Your Personal Tour Guide
Ask me questions while you tour the home.