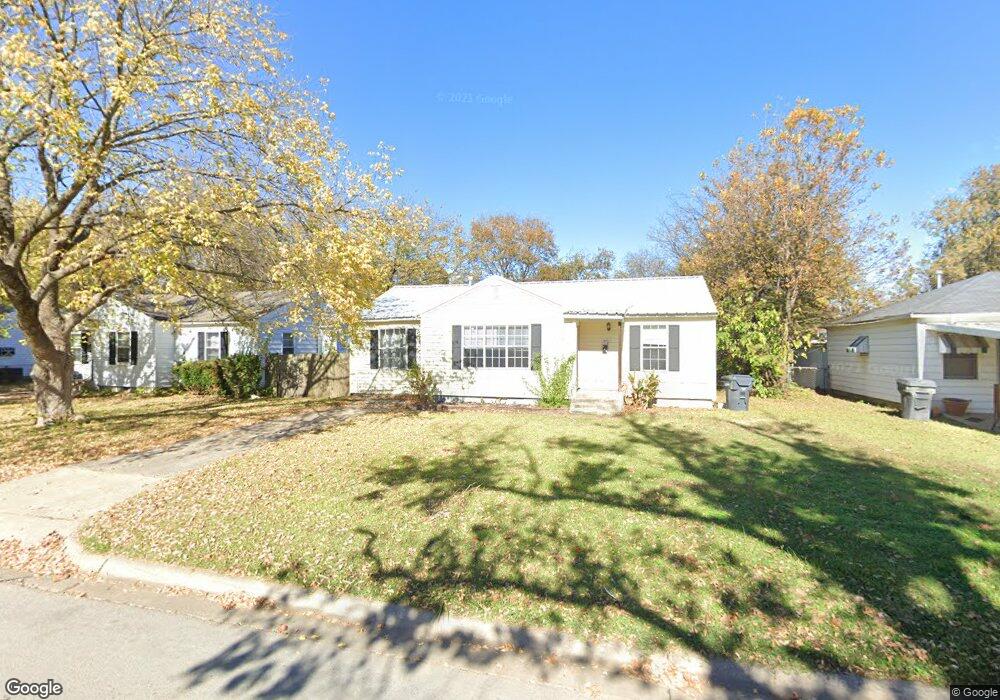
709 Davis St NW Ardmore, OK 73401
Estimated Value: $99,000 - $116,000
2
Beds
2
Baths
1,320
Sq Ft
$82/Sq Ft
Est. Value
About This Home
This home is located at 709 Davis St NW, Ardmore, OK 73401 and is currently estimated at $107,595, approximately $81 per square foot. 709 Davis St NW is a home located in Carter County with nearby schools including Charles Evans Elementary School, Ardmore Middle School, and Ardmore High School.
Ownership History
Date
Name
Owned For
Owner Type
Purchase Details
Closed on
Jul 26, 2024
Sold by
Vaughn Toby J and Vaughn Jessica P
Bought by
Oak Tree Investments Llc
Current Estimated Value
Purchase Details
Closed on
Mar 16, 2022
Sold by
Andrew Carsten Nathan and Andrew Kristin
Bought by
Vaughn Toby J and Vaughn Jessica P
Home Financials for this Owner
Home Financials are based on the most recent Mortgage that was taken out on this home.
Original Mortgage
$63,750
Interest Rate
3.85%
Mortgage Type
Balloon
Purchase Details
Closed on
Feb 4, 2020
Sold by
U S Bank National Association
Bought by
Carsten Nathan Andrew
Purchase Details
Closed on
Jun 30, 2010
Sold by
Holden Dean R and Holden Charra
Bought by
Williams Ladye M
Purchase Details
Closed on
Jun 21, 1996
Sold by
Wernli Joe L
Bought by
Holden Dean R and Holden Charr
Create a Home Valuation Report for This Property
The Home Valuation Report is an in-depth analysis detailing your home's value as well as a comparison with similar homes in the area
Home Values in the Area
Average Home Value in this Area
Purchase History
| Date | Buyer | Sale Price | Title Company |
|---|---|---|---|
| Oak Tree Investments Llc | -- | None Listed On Document | |
| Vaughn Toby J | $85,000 | Stewart Title | |
| Carsten Nathan Andrew | $51,500 | None Available | |
| Williams Ladye M | $69,500 | -- | |
| Holden Dean R | $22,000 | -- |
Source: Public Records
Mortgage History
| Date | Status | Borrower | Loan Amount |
|---|---|---|---|
| Previous Owner | Vaughn Toby J | $63,750 |
Source: Public Records
Tax History Compared to Growth
Tax History
| Year | Tax Paid | Tax Assessment Tax Assessment Total Assessment is a certain percentage of the fair market value that is determined by local assessors to be the total taxable value of land and additions on the property. | Land | Improvement |
|---|---|---|---|---|
| 2025 | $1,014 | $10,159 | $2,400 | $7,759 |
| 2024 | $1,014 | $10,710 | $2,400 | $8,310 |
| 2023 | $1,069 | $10,200 | $2,400 | $7,800 |
| 2022 | $820 | $8,575 | $2,263 | $6,312 |
| 2021 | $824 | $8,167 | $2,168 | $5,999 |
| 2020 | $773 | $7,778 | $1,440 | $6,338 |
| 2019 | $754 | $7,763 | $1,437 | $6,326 |
| 2018 | $730 | $7,394 | $960 | $6,434 |
| 2017 | $676 | $7,394 | $960 | $6,434 |
| 2016 | $754 | $8,086 | $605 | $7,481 |
| 2015 | $592 | $7,701 | $605 | $7,096 |
| 2014 | $733 | $8,197 | $605 | $7,592 |
Source: Public Records
Map
Nearby Homes
- 722 Maxwell St NW
- 723 Maxwell St NW
- 809 Campbell St
- 912 Maxwell St NW
- 912 Elm St
- 715 Ash St
- 1907 Robison St
- 923 Maxwell St NW
- 00 N Rockford Rd
- 505 Campbell St
- 818 Northwest Blvd
- 800 Cottonwood St
- 1029 Northwest Blvd
- 0 15th Unit 2546881
- 1412 Healdton Blvd
- 703 Cottonwood St
- 625 Northwest Ave
- 513 Northwest Blvd
- 1817 Comanche St
- 1323 Hargrove St
- 707 Davis St NW
- 711 Davis St NW
- 705 Davis St NW
- 713 Davis St NW
- 708 Maxwell St NW
- 706 Maxwell St NW
- 710 Maxwell St NW
- 703 Davis St NW
- 715 Davis St NW
- 708 Davis St NW
- 704 Maxwell St NW
- 712 Maxwell St NW
- 710 Davis St NW
- 706 Davis St NW
- 712 Davis St NW
- 704 Davis St NW
- 717 Davis St NW
- 702 Maxwell St NW
- 701 Davis St NW
- 714 Maxwell St NW