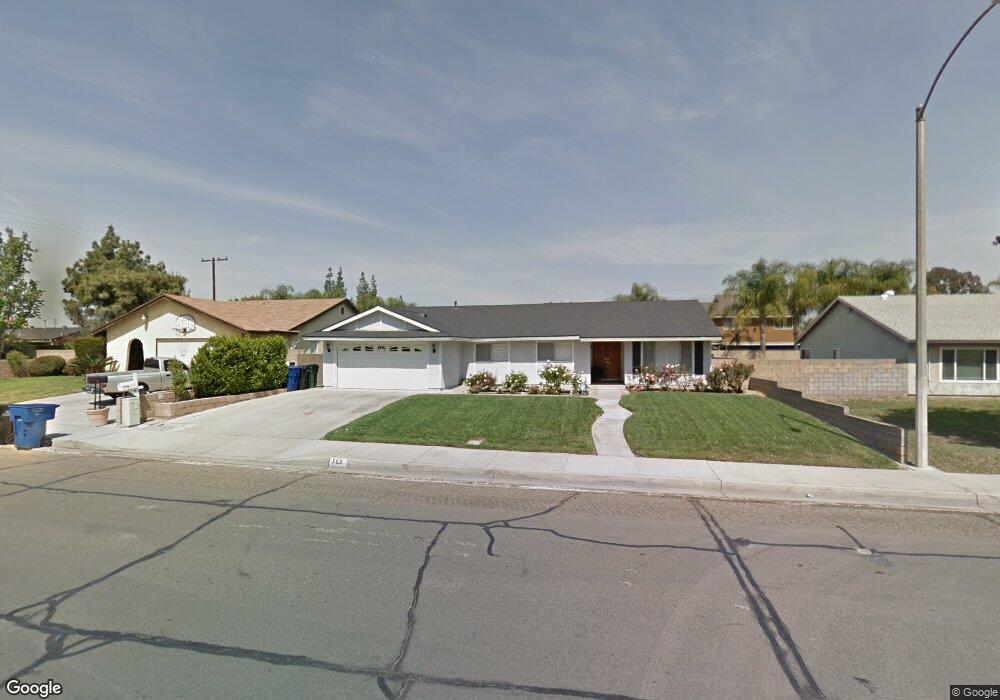
709 E Banyan St Ontario, CA 91761
Downtown Ontario NeighborhoodEstimated Value: $705,459 - $744,000
4
Beds
2
Baths
1,524
Sq Ft
$472/Sq Ft
Est. Value
About This Home
This home is located at 709 E Banyan St, Ontario, CA 91761 and is currently estimated at $719,865, approximately $472 per square foot. 709 E Banyan St is a home located in San Bernardino County with nearby schools including Bon View Elementary, De Anza Middle, and Ontario High School.
Ownership History
Date
Name
Owned For
Owner Type
Purchase Details
Closed on
Aug 1, 2024
Sold by
Seanez Cristina I and Cristina Isabel Seanez Family Trust
Bought by
Cristina Isabel Seanez Family Trust and Seanez-Berkley
Current Estimated Value
Home Financials for this Owner
Home Financials are based on the most recent Mortgage that was taken out on this home.
Original Mortgage
$60,000
Outstanding Balance
$59,321
Interest Rate
6.87%
Mortgage Type
Credit Line Revolving
Estimated Equity
$660,544
Purchase Details
Closed on
Aug 4, 2005
Sold by
Seanez Cristina I
Bought by
Seanez Cristina I and The Cristina Isabel Seanez Fam
Purchase Details
Closed on
Jul 11, 1997
Sold by
Isaksen Robert Hseanez
Bought by
Seanez Cristina I
Purchase Details
Closed on
Mar 15, 1995
Sold by
Isaksen Robert H
Bought by
Isaksen Robert H and Seanez Cristina I
Create a Home Valuation Report for This Property
The Home Valuation Report is an in-depth analysis detailing your home's value as well as a comparison with similar homes in the area
Home Values in the Area
Average Home Value in this Area
Purchase History
| Date | Buyer | Sale Price | Title Company |
|---|---|---|---|
| Cristina Isabel Seanez Family Trust | -- | Ticor Title | |
| Seanez Cristina I | -- | -- | |
| Seanez Cristina I | -- | -- | |
| Isaksen Robert H | -- | Continental Lawyers Title Co |
Source: Public Records
Mortgage History
| Date | Status | Borrower | Loan Amount |
|---|---|---|---|
| Open | Cristina Isabel Seanez Family Trust | $60,000 |
Source: Public Records
Tax History
| Year | Tax Paid | Tax Assessment Tax Assessment Total Assessment is a certain percentage of the fair market value that is determined by local assessors to be the total taxable value of land and additions on the property. | Land | Improvement |
|---|---|---|---|---|
| 2025 | $2,204 | $194,807 | $63,870 | $130,937 |
| 2024 | $2,155 | $190,988 | $62,618 | $128,370 |
| 2023 | $2,096 | $187,243 | $61,390 | $125,853 |
| 2022 | $2,070 | $183,571 | $60,186 | $123,385 |
| 2021 | $2,057 | $179,972 | $59,006 | $120,966 |
| 2020 | $2,022 | $178,127 | $58,401 | $119,726 |
| 2019 | $2,005 | $174,634 | $57,256 | $117,378 |
| 2018 | $1,979 | $171,209 | $56,133 | $115,076 |
| 2017 | $1,909 | $167,852 | $55,032 | $112,820 |
| 2016 | $1,836 | $164,561 | $53,953 | $110,608 |
| 2015 | $1,824 | $162,090 | $53,143 | $108,947 |
| 2014 | $1,770 | $158,915 | $52,102 | $106,813 |
Source: Public Records
Map
Nearby Homes
- 2408 S Taylor Place
- 513 E Fairfield Ct
- 2300 S Sultana Ave Unit 298
- 2300 S Sultana Ave Unit 286
- 2300 S Sultana Ave Unit 256
- 2300 S Sultana Ave Unit 206
- 4315 S Grasly Paseo
- 0 Vineyard Unit CV25067044
- 1528 1538 W Holt
- 1305 W North Pinecrest
- 619 E Joseph Privado
- 2119 S Phoenix Place
- 683 E Joseph Privado
- 2644 S Cucamonga Ave
- 310 E Philadelphia St Unit 147
- 310 E Philadelphia St
- 310 E Philadelphia St Unit SPC 102
- 2431 S Marigold Place
- 665 E Riverside Dr Unit 3
- 2001 S Campus Ave Unit 7F
- 715 E Banyan St
- 703 E Banyan St
- 708 E Oak Hill St
- 714 E Oak Hill St
- 702 E Oak Hill St
- 721 E Banyan St
- 2520 S Phoenix Place
- 720 E Oak Hill St
- 2521 S Phoenix Place
- 2526 S Phoenix Place
- 727 E Banyan St
- 726 E Oak Hill St
- 2527 S Phoenix Place
- 675 E Banyan St
- 2438 S Phoenix Place
- 666 E Oak Hill St
- 2532 S Phoenix Place
- 2520 S Caldwell Ave
- 732 E Oak Hill St
- 669 E Banyan St
Your Personal Tour Guide
Ask me questions while you tour the home.