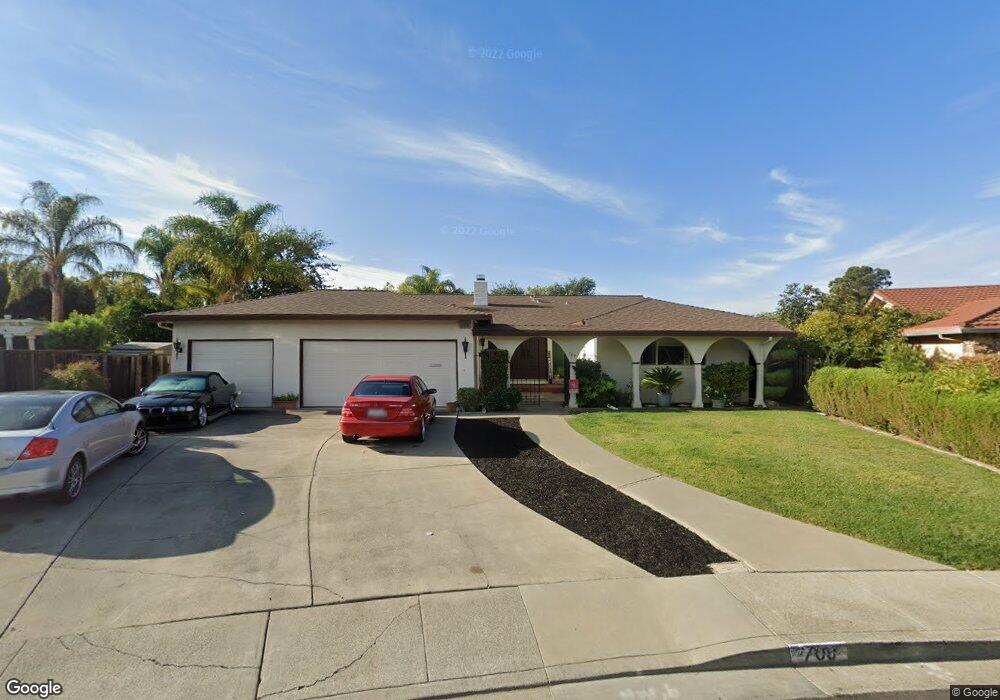
709 Graymont Cir Concord, CA 94518
Shadelands NeighborhoodEstimated Value: $979,000 - $1,227,284
4
Beds
3
Baths
2,319
Sq Ft
$471/Sq Ft
Est. Value
About This Home
This home is located at 709 Graymont Cir, Concord, CA 94518 and is currently estimated at $1,092,821, approximately $471 per square foot. 709 Graymont Cir is a home located in Contra Costa County with nearby schools including Woodside Elementary School, Oak Grove Middle School, and Ygnacio Valley High School.
Ownership History
Date
Name
Owned For
Owner Type
Purchase Details
Closed on
Feb 28, 2022
Sold by
Jeannine Araiza
Bought by
Araiza Jonathan
Current Estimated Value
Home Financials for this Owner
Home Financials are based on the most recent Mortgage that was taken out on this home.
Original Mortgage
$847,500
Outstanding Balance
$791,838
Interest Rate
3.92%
Mortgage Type
New Conventional
Estimated Equity
$300,983
Purchase Details
Closed on
Feb 11, 2022
Sold by
James Cox Robert
Bought by
Cox Lonette R
Home Financials for this Owner
Home Financials are based on the most recent Mortgage that was taken out on this home.
Original Mortgage
$847,500
Outstanding Balance
$791,838
Interest Rate
3.92%
Mortgage Type
New Conventional
Estimated Equity
$300,983
Purchase Details
Closed on
Sep 17, 2021
Sold by
Mildred Clinkenbeard Virginia
Bought by
Lonnie L Clinkenbeard And Virginia M Clinkenb and Clinkenbeard Virg
Create a Home Valuation Report for This Property
The Home Valuation Report is an in-depth analysis detailing your home's value as well as a comparison with similar homes in the area
Home Values in the Area
Average Home Value in this Area
Purchase History
| Date | Buyer | Sale Price | Title Company |
|---|---|---|---|
| Araiza Jonathan | -- | Old Republic Title | |
| Cox Lonette | -- | Old Republic Title | |
| Cox Lonette R | -- | Old Republic Title | |
| Lonnie L Clinkenbeard And Virginia M Clinkenb | -- | -- |
Source: Public Records
Mortgage History
| Date | Status | Borrower | Loan Amount |
|---|---|---|---|
| Open | Cox Lonette | $847,500 |
Source: Public Records
Tax History Compared to Growth
Tax History
| Year | Tax Paid | Tax Assessment Tax Assessment Total Assessment is a certain percentage of the fair market value that is determined by local assessors to be the total taxable value of land and additions on the property. | Land | Improvement |
|---|---|---|---|---|
| 2025 | $2,443 | $144,196 | $41,744 | $102,452 |
| 2024 | $2,374 | $141,370 | $40,926 | $100,444 |
| 2023 | $2,374 | $138,599 | $40,124 | $98,475 |
| 2022 | $11,713 | $969,000 | $601,800 | $367,200 |
| 2021 | $2,240 | $133,219 | $38,567 | $94,652 |
| 2019 | $2,180 | $129,270 | $37,424 | $91,846 |
| 2018 | $2,084 | $126,737 | $36,691 | $90,046 |
| 2017 | $1,998 | $124,253 | $35,972 | $88,281 |
| 2016 | $1,913 | $121,817 | $35,267 | $86,550 |
| 2015 | $1,857 | $119,988 | $34,738 | $85,250 |
| 2014 | $1,793 | $117,639 | $34,058 | $83,581 |
Source: Public Records
Map
Nearby Homes
- 738 Mandarin Ln
- 3050 Barrymore Dr
- 721 Santa Ana Ln
- 2890 Treat Blvd Unit 51
- 517 Heather Grove Ct
- 632 Wintergreen Ln
- 3051 Treat Blvd Unit 63
- 3051 Treat Blvd Unit 129
- 3055 Treat Blvd Unit 25
- 810 Oak Grove Rd Unit 83
- 810 Oak Grove Rd Unit 106
- 825 Oak Grove Rd Unit 35
- 825 Oak Grove Rd Unit 46
- 825 Oak Grove Rd Unit 62
- 2830 Royal Ann Ln
- 206 Hamlin Loop
- 2605 Ryan Rd
- 401 Seville Ln
- 887 Andrix Ct
- 2765 Ryan Rd
- 711 Graymont Cir
- 707 Graymont Cir
- 706 Graymont Cir
- 705 Graymont Cir
- 713 Graymont Cir
- 704 Graymont Cir
- 703 Graymont Cir
- 708 Graymont Cir
- 702 Graymont Cir
- 2960 Parrin Ct
- 701 Graymont Cir
- 717 Graymont Cir
- 700 Graymont Cir
- 2970 Parrin Ct
- 719 Graymont Cir
- 2965 Parrin Ct
- 2980 Parrin Ct
- 702 Oak Grove Rd Unit D
- 702 Oak Grove Rd Unit C
- 702 Oak Grove Rd Unit B