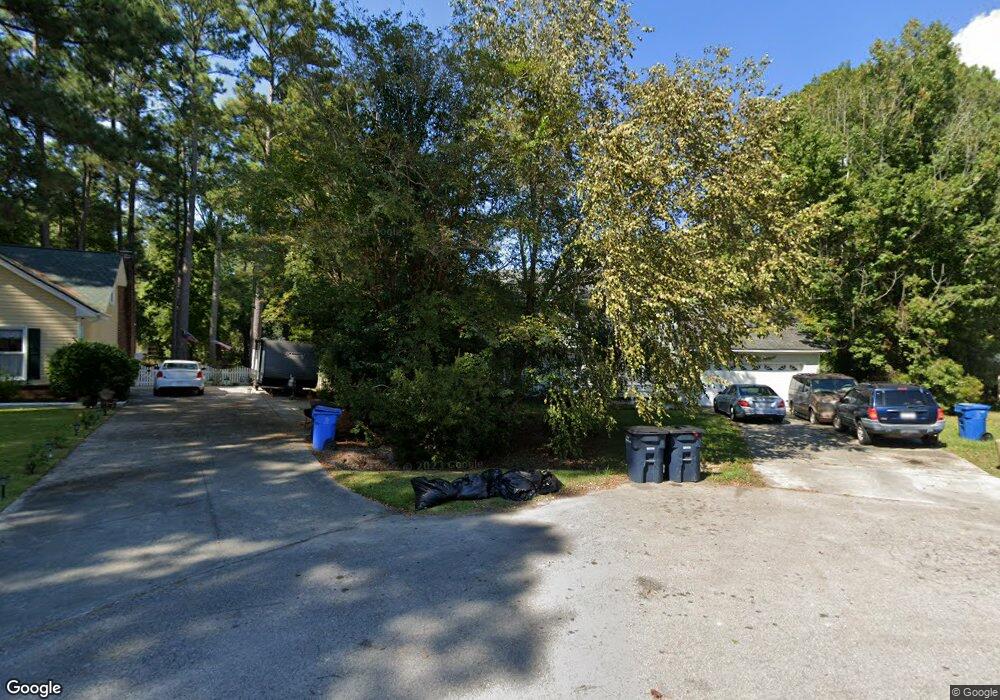
709 Ireland Ct Jacksonville, NC 28546
Estimated Value: $288,419 - $323,000
4
Beds
2
Baths
2,141
Sq Ft
$145/Sq Ft
Est. Value
About This Home
This home is located at 709 Ireland Ct, Jacksonville, NC 28546 and is currently estimated at $310,605, approximately $145 per square foot. 709 Ireland Ct is a home located in Onslow County with nearby schools including Bell Fork Elementary School, White Oak High School, and Fellowship Christian Academy.
Ownership History
Date
Name
Owned For
Owner Type
Purchase Details
Closed on
Oct 8, 2010
Sold by
Secretary Of Housing & Urban Development
Bought by
Holder Barbara and Holder Eddie
Current Estimated Value
Home Financials for this Owner
Home Financials are based on the most recent Mortgage that was taken out on this home.
Original Mortgage
$92,000
Outstanding Balance
$60,772
Interest Rate
4.37%
Mortgage Type
Future Advance Clause Open End Mortgage
Estimated Equity
$249,833
Purchase Details
Closed on
Aug 7, 2009
Sold by
Wells Fargo Bank Na
Bought by
Secretary Of Housing & Urban Development
Purchase Details
Closed on
May 2, 2008
Sold by
Leblanc John D
Bought by
Leblanc Ellen H
Home Financials for this Owner
Home Financials are based on the most recent Mortgage that was taken out on this home.
Original Mortgage
$241,061
Interest Rate
6.08%
Mortgage Type
FHA
Create a Home Valuation Report for This Property
The Home Valuation Report is an in-depth analysis detailing your home's value as well as a comparison with similar homes in the area
Home Values in the Area
Average Home Value in this Area
Purchase History
| Date | Buyer | Sale Price | Title Company |
|---|---|---|---|
| Holder Barbara | -- | None Available | |
| Secretary Of Housing & Urban Development | -- | None Available | |
| Wells Fargo Bank Na | $260,780 | None Available | |
| Leblanc Ellen H | -- | None Available |
Source: Public Records
Mortgage History
| Date | Status | Borrower | Loan Amount |
|---|---|---|---|
| Open | Holder Barbara | $92,000 | |
| Previous Owner | Leblanc Ellen H | $241,061 |
Source: Public Records
Tax History Compared to Growth
Tax History
| Year | Tax Paid | Tax Assessment Tax Assessment Total Assessment is a certain percentage of the fair market value that is determined by local assessors to be the total taxable value of land and additions on the property. | Land | Improvement |
|---|---|---|---|---|
| 2025 | $2,761 | $219,987 | $35,000 | $184,987 |
| 2024 | $2,761 | $219,987 | $35,000 | $184,987 |
| 2023 | $2,761 | $219,987 | $35,000 | $184,987 |
| 2022 | $2,761 | $219,987 | $35,000 | $184,987 |
| 2021 | $2,219 | $164,700 | $35,000 | $129,700 |
| 2020 | $2,219 | $164,700 | $35,000 | $129,700 |
| 2019 | $2,219 | $164,700 | $35,000 | $129,700 |
| 2018 | $2,219 | $164,700 | $35,000 | $129,700 |
| 2017 | $2,001 | $151,970 | $40,000 | $111,970 |
| 2016 | $2,001 | $151,970 | $0 | $0 |
| 2015 | $2,001 | $151,970 | $0 | $0 |
| 2014 | $2,001 | $151,970 | $0 | $0 |
Source: Public Records
Map
Nearby Homes
- 705 Ireland Ct
- 2228 Colony Plaza
- 108 Kingsmill Ct
- 902 Welsh Ln
- 2230 Greenwood Ct
- 404 Hampshire Place
- 405 Hampshire Place
- 120 Winthrope Way
- 2002 Colony Plaza
- 914 Eton Dr
- 105 Kenan Loop
- 2104 Colony Plaza
- 402 Huff Dr
- 103 Huff Ct
- 403 Country Club Dr
- 102 W Cameron Ct
- 202 Noble Ln
- 103 Dunhill Ct
- 107 Knight Place
- 1 Lee Ct
- 707 Ireland Ct
- 1011 Greenway Dr
- 710 Ireland Ct
- 1009 Greenway Dr
- 2108 Perry Dr
- 1013 Greenway Dr
- 708 Ireland Ct
- 706 Ireland Ct
- 1007 Greenway Dr
- 703 Ireland Ct
- 2106 Perry Dr
- 615 Clover Dr
- 613 Clover Dr
- 704 Ireland Ct
- 611 Clover Dr
- 2235 Perry Dr
- 1012 Greenway Dr
- 702 Ireland Ct
- 1103 Greenway Dr
- 609 Clover Dr