Estimated Value: $418,000 - $528,000
4
Beds
3
Baths
2,679
Sq Ft
$183/Sq Ft
Est. Value
About This Home
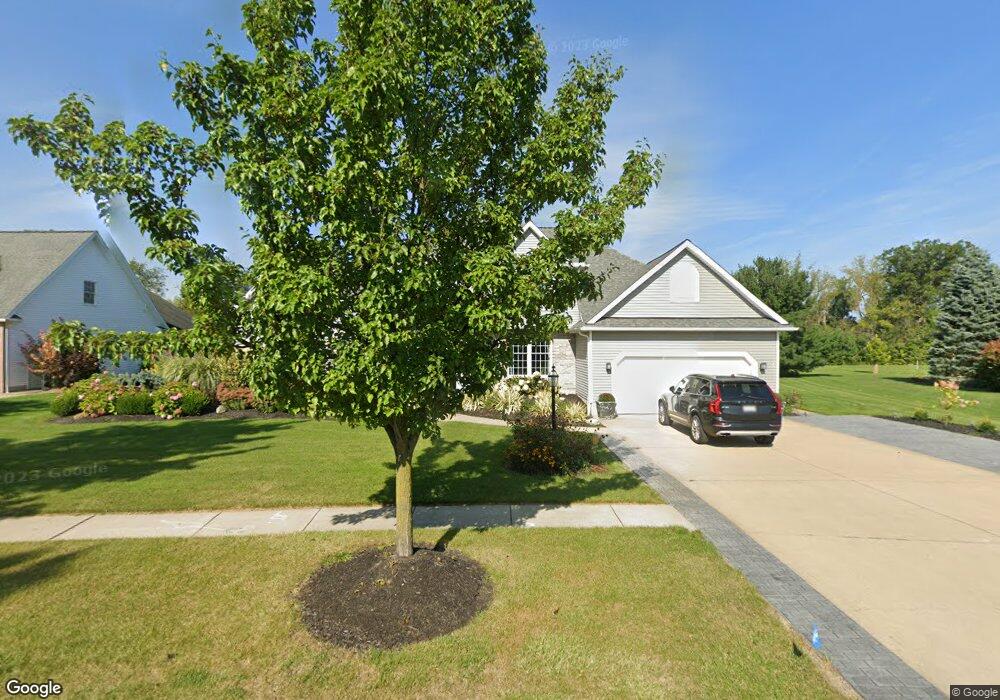
This home is located at 709 Kingfisher Ct, Huron, OH 44839 and is currently estimated at $489,547, approximately $182 per square foot. 709 Kingfisher Ct is a home located in Erie County with nearby schools including Shawnee Elementary School, Woodlands Intermediate School, and McCormick Junior High School.
Ownership History
Date
Name
Owned For
Owner Type
Purchase Details
Closed on
Apr 19, 2024
Sold by
Jones Jeremy Dean and Jones Cynthia Ann
Bought by
Jeremy Dean Jones Revocable and Cynthia Ann Jones Revocable Trust
Current Estimated Value
Purchase Details
Closed on
Aug 31, 2010
Sold by
Wostmann Don A and Wostmann Christin A
Bought by
Jones Jeremy D and Jones Cynthia A
Home Financials for this Owner
Home Financials are based on the most recent Mortgage that was taken out on this home.
Original Mortgage
$261,478
Interest Rate
4.37%
Mortgage Type
FHA
Purchase Details
Closed on
Jun 1, 2001
Sold by
Majoy Dominic
Bought by
Wostmann Don A and Wostmann Christin A
Home Financials for this Owner
Home Financials are based on the most recent Mortgage that was taken out on this home.
Original Mortgage
$245,300
Interest Rate
7.23%
Mortgage Type
New Conventional
Create a Home Valuation Report for This Property
The Home Valuation Report is an in-depth analysis detailing your home's value as well as a comparison with similar homes in the area
Home Values in the Area
Average Home Value in this Area
Purchase History
| Date | Buyer | Sale Price | Title Company |
|---|---|---|---|
| Jeremy Dean Jones Revocable | -- | None Listed On Document | |
| Jones Jeremy D | $265,000 | Lawyers Title Ins Corp | |
| Wostmann Don A | $265,330 | -- |
Source: Public Records
Mortgage History
| Date | Status | Borrower | Loan Amount |
|---|---|---|---|
| Previous Owner | Jones Jeremy D | $261,478 | |
| Previous Owner | Wostmann Don A | $245,300 |
Source: Public Records
Tax History
| Year | Tax Paid | Tax Assessment Tax Assessment Total Assessment is a certain percentage of the fair market value that is determined by local assessors to be the total taxable value of land and additions on the property. | Land | Improvement |
|---|---|---|---|---|
| 2024 | $5,856 | $152,334 | $17,514 | $134,820 |
| 2023 | $6,018 | $113,074 | $15,921 | $97,153 |
| 2022 | $4,776 | $113,074 | $15,921 | $97,153 |
| 2021 | $4,771 | $113,070 | $15,920 | $97,150 |
| 2020 | $4,562 | $105,240 | $15,920 | $89,320 |
| 2019 | $4,759 | $105,240 | $15,920 | $89,320 |
| 2018 | $4,784 | $105,240 | $15,920 | $89,320 |
| 2017 | $4,152 | $88,390 | $17,000 | $71,390 |
| 2016 | $4,023 | $88,390 | $17,000 | $71,390 |
| 2015 | $4,018 | $88,390 | $17,000 | $71,390 |
| 2014 | $4,064 | $88,390 | $17,000 | $71,390 |
| 2013 | $4,007 | $88,390 | $17,000 | $71,390 |
Source: Public Records
Map
Nearby Homes
- 618 Cleveland Rd E
- 1100 By-The-shores Dr Unit 1
- 1110 By the Shores Dr Unit 4
- 1120 By the Shores Dr Unit 2
- 603 Ottawa Dr
- 419 Miami Place
- 38 VL Youness
- 1505 Cleveland Rd E Unit 331
- 1505 Cleveland Rd E Unit 334
- 613 Oneida View Place
- 508 Snowy Egret Dr
- 352 Main St Unit B
- 28 Turtle Bay
- 1140 Sheltered Brook Dr
- 130 N Port Ln
- 128 N Port Ln
- 676 Salem Dr
- 1133 Sheltered Brook Dr
- 110 Wheeler Dr
- 0 Main St
- 707 Kingfisher Ct
- 711 Kingfisher Ct
- 63 Kingfisher Ct
- 68 Kingfisher Ct
- 64 Kingfisher Ct
- 66 Kingfisher Ct
- 69 Kingfisher Ct
- 70 Kingfisher Ct
- 61 Kingfisher Ct
- 71 Kingfisher Ct
- 65 Kingfisher Ct
- 67 Kingfisher Ct
- 60 Kingfisher Ct
- 62 Kingfisher Ct
- 59 Kingfisher Ct
- 705 Kingfisher Ct
- 708 Kingfisher Ct
- 713 Kingfisher Ct
- 710 Kingfisher Ct
- 703 Kingfisher Ct
Your Personal Tour Guide
Ask me questions while you tour the home.