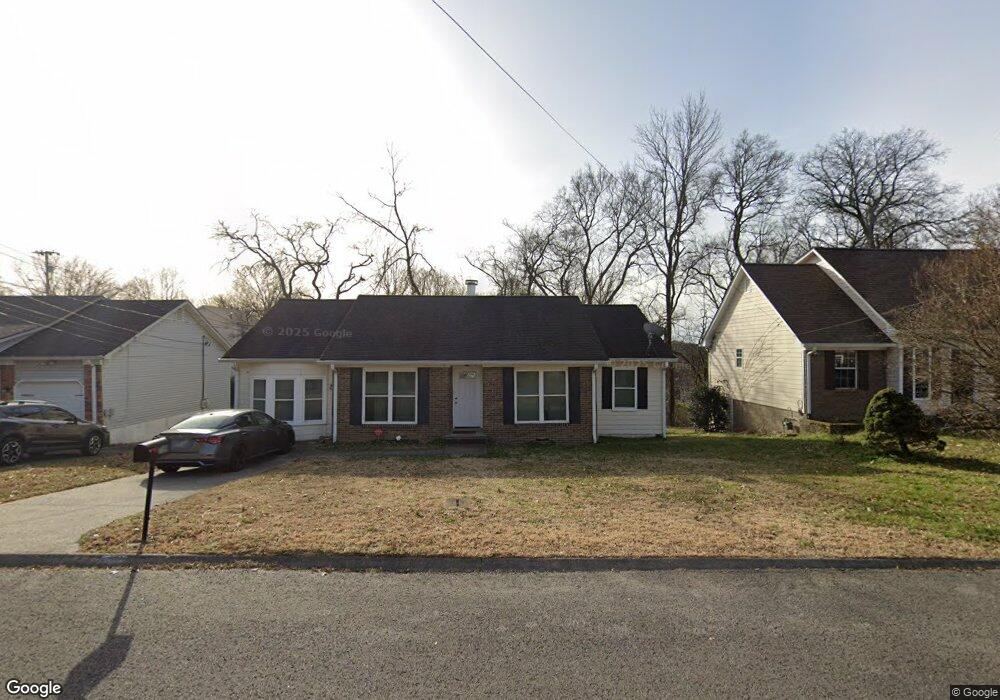
709 Knightsbridge Way Antioch, TN 37013
Estimated Value: $323,237 - $356,000
3
Beds
2
Baths
1,528
Sq Ft
$222/Sq Ft
Est. Value
About This Home
This home is located at 709 Knightsbridge Way, Antioch, TN 37013 and is currently estimated at $338,809, approximately $221 per square foot. 709 Knightsbridge Way is a home located in Davidson County with nearby schools including Una Elementary School, Margaret Allen Middle School, and Antioch High School.
Ownership History
Date
Name
Owned For
Owner Type
Purchase Details
Closed on
Dec 28, 2011
Sold by
Eyer Nicole S
Bought by
Eyer Ronald E
Current Estimated Value
Purchase Details
Closed on
Oct 15, 2008
Sold by
Harkness Lewis A and Harkness Kimberly
Bought by
Eyer Ronald E and Eyer Nicole S
Home Financials for this Owner
Home Financials are based on the most recent Mortgage that was taken out on this home.
Original Mortgage
$127,500
Outstanding Balance
$84,418
Interest Rate
6.34%
Mortgage Type
VA
Estimated Equity
$254,391
Purchase Details
Closed on
Aug 31, 1998
Sold by
Cornelland David A and Skoczylas Anna
Bought by
Harkness Lewis A
Home Financials for this Owner
Home Financials are based on the most recent Mortgage that was taken out on this home.
Original Mortgage
$100,846
Interest Rate
6.99%
Mortgage Type
FHA
Purchase Details
Closed on
Aug 10, 1995
Sold by
Mayfield Jeffrey S
Bought by
Cornell David A and Cornell Skoczyla
Create a Home Valuation Report for This Property
The Home Valuation Report is an in-depth analysis detailing your home's value as well as a comparison with similar homes in the area
Home Values in the Area
Average Home Value in this Area
Purchase History
| Date | Buyer | Sale Price | Title Company |
|---|---|---|---|
| Eyer Ronald E | -- | None Available | |
| Eyer Ronald E | $127,500 | Multiple | |
| Harkness Lewis A | $100,900 | Guaranty Title & Escrow Co | |
| Cornell David A | $85,000 | -- |
Source: Public Records
Mortgage History
| Date | Status | Borrower | Loan Amount |
|---|---|---|---|
| Open | Eyer Ronald E | $127,500 | |
| Previous Owner | Harkness Lewis A | $100,846 |
Source: Public Records
Tax History Compared to Growth
Tax History
| Year | Tax Paid | Tax Assessment Tax Assessment Total Assessment is a certain percentage of the fair market value that is determined by local assessors to be the total taxable value of land and additions on the property. | Land | Improvement |
|---|---|---|---|---|
| 2024 | $1,705 | $52,400 | $11,475 | $40,925 |
| 2023 | $1,705 | $52,400 | $11,475 | $40,925 |
| 2022 | $1,985 | $52,400 | $11,475 | $40,925 |
| 2021 | $1,723 | $52,400 | $11,475 | $40,925 |
| 2020 | $1,632 | $38,675 | $8,000 | $30,675 |
| 2019 | $1,220 | $38,675 | $8,000 | $30,675 |
Source: Public Records
Map
Nearby Homes
- 121 Elizabeths Ct
- 112 Elizabeths Ct
- 552 Piccadilly Row
- 516 Franklin Limestone Rd
- 104 Sandia Peak Ct
- 816 Rocky Mountain Pkwy
- 2121 Ransom Place
- 716 Rocky Mountain Ct
- 1152 White Mountain Ln
- 1708 Olive Cir
- 216 Pepper Ridge Cir
- 104 Pepper Ridge Cir Unit 104
- 408 Hampstead S
- 3208 Grace Crest Point
- 420 Black Mountain Dr
- 4928 Oak Barrel Dr
- 905 Split Oak Dr
- 2520 Johnson Ridge Rd
- 2616 Mountain Laurel Dr
- 1025 Capital Funds Ct
- 705 Knightsbridge Way
- 713 Knightsbridge Way
- 705 Knights Bridge Way
- 717 Knightsbridge Way
- 837 Bishopsgate Rd
- 701 Knightsbridge Way
- 833 Bishopsgate Rd
- 716 Knightsbridge Way
- 712 Knightsbridge Way
- 708 Knights Bridge Way
- 720 Knightsbridge Way
- 721 Knightsbridge Way
- 829 Bishopsgate Rd
- 708 Knightsbridge Way
- 724 Knightsbridge Way
- 725 Knightsbridge Way
- 840 Bishopsgate Rd
- 704 Knightsbridge Way
- 825 Bishopsgate Rd
- 700 Knightsbridge Way