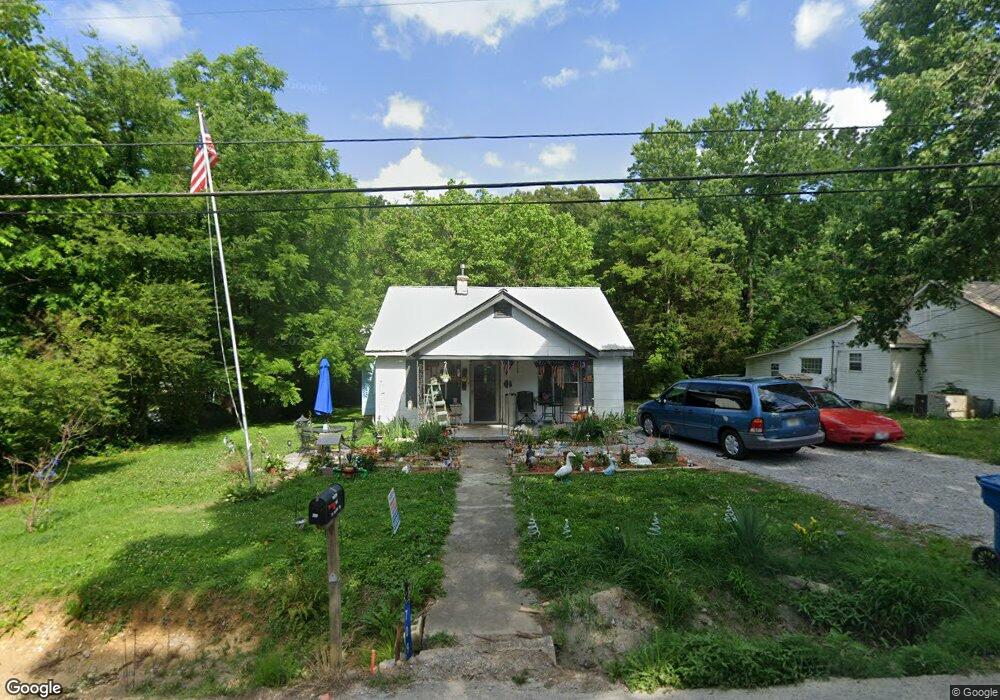
709 Madison St Manchester, TN 37355
Estimated Value: $98,000 - $177,000
--
Bed
1
Bath
1,069
Sq Ft
$130/Sq Ft
Est. Value
About This Home
This home is located at 709 Madison St, Manchester, TN 37355 and is currently estimated at $139,017, approximately $130 per square foot. 709 Madison St is a home located in Coffee County with nearby schools including Westwood Middle School and Temple Baptist Christian School.
Ownership History
Date
Name
Owned For
Owner Type
Purchase Details
Closed on
Apr 15, 2025
Sold by
Blackwell Beverly R and Phillips Beverly R
Bought by
Phillips Beverly R and Page Kalvin
Current Estimated Value
Purchase Details
Closed on
Oct 14, 2005
Sold by
Luneack John
Bought by
Blackwell Beverly R
Home Financials for this Owner
Home Financials are based on the most recent Mortgage that was taken out on this home.
Original Mortgage
$30,957
Interest Rate
5.71%
Purchase Details
Closed on
May 13, 2004
Bought by
Luneack John
Purchase Details
Closed on
Jun 30, 1997
Bought by
Harding Richard F and Harding Cherry
Create a Home Valuation Report for This Property
The Home Valuation Report is an in-depth analysis detailing your home's value as well as a comparison with similar homes in the area
Home Values in the Area
Average Home Value in this Area
Purchase History
| Date | Buyer | Sale Price | Title Company |
|---|---|---|---|
| Phillips Beverly R | -- | None Listed On Document | |
| Phillips Beverly R | -- | None Listed On Document | |
| Blackwell Beverly R | $50,000 | -- | |
| Luneack John | $25,600 | -- | |
| Harding Richard F | $40,000 | -- |
Source: Public Records
Mortgage History
| Date | Status | Borrower | Loan Amount |
|---|---|---|---|
| Previous Owner | Harding Richard F | $30,957 |
Source: Public Records
Tax History Compared to Growth
Tax History
| Year | Tax Paid | Tax Assessment Tax Assessment Total Assessment is a certain percentage of the fair market value that is determined by local assessors to be the total taxable value of land and additions on the property. | Land | Improvement |
|---|---|---|---|---|
| 2024 | $624 | $14,800 | $2,900 | $11,900 |
| 2023 | $624 | $14,800 | $0 | $0 |
| 2022 | $537 | $14,800 | $2,900 | $11,900 |
| 2021 | $493 | $10,775 | $2,000 | $8,775 |
| 2020 | $493 | $10,775 | $2,000 | $8,775 |
| 2019 | $493 | $10,775 | $2,000 | $8,775 |
| 2018 | $493 | $10,775 | $2,000 | $8,775 |
| 2017 | $534 | $10,175 | $2,000 | $8,175 |
| 2016 | $534 | $10,175 | $2,000 | $8,175 |
| 2015 | $534 | $10,175 | $2,000 | $8,175 |
| 2014 | $534 | $10,183 | $0 | $0 |
Source: Public Records
Map
Nearby Homes