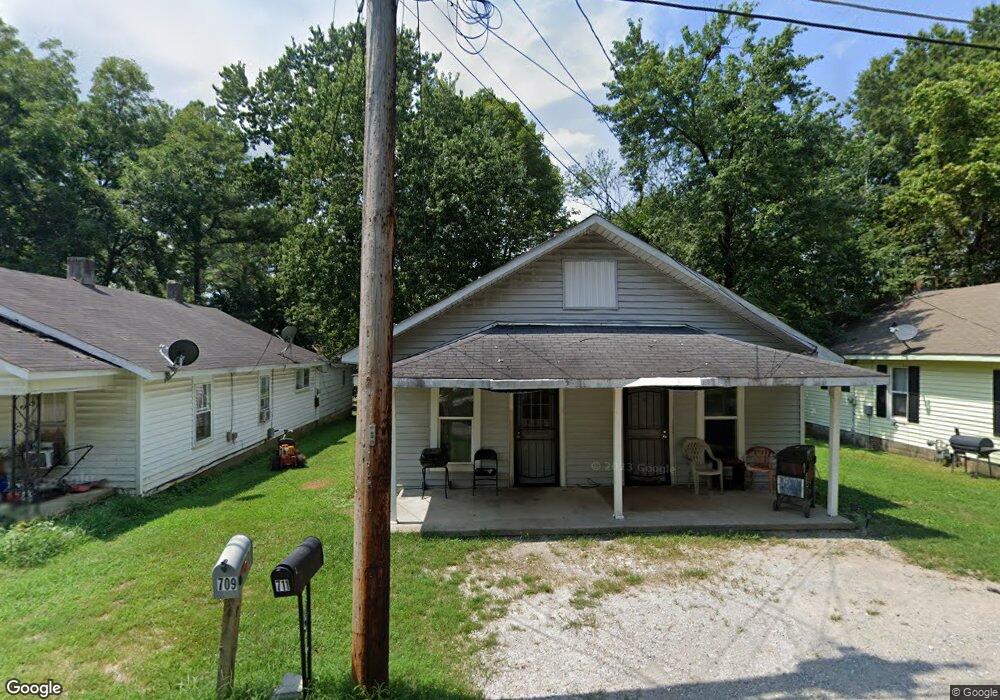
709 N 20th Ave Unit 711 Humboldt, TN 38343
Estimated Value: $42,000 - $86,667
--
Bed
2
Baths
1,080
Sq Ft
$53/Sq Ft
Est. Value
About This Home
This home is located at 709 N 20th Ave Unit 711, Humboldt, TN 38343 and is currently estimated at $56,917, approximately $52 per square foot. 709 N 20th Ave Unit 711 is a home located in Gibson County with nearby schools including Stigall Primary School, East Elementary School, and Humboldt Middle School.
Ownership History
Date
Name
Owned For
Owner Type
Purchase Details
Closed on
May 22, 2024
Sold by
Osler Dominique and Osler Caderious
Bought by
C & C Investments Gp
Current Estimated Value
Purchase Details
Closed on
May 28, 2021
Sold by
Osler Anthony
Bought by
Osler Dominique and Osler Caderious
Purchase Details
Closed on
May 12, 2017
Sold by
William Aston
Bought by
Anthony Osler
Purchase Details
Closed on
Nov 5, 2008
Sold by
Aston William
Bought by
Aston William
Purchase Details
Closed on
Oct 27, 2004
Sold by
Doolin Steve
Bought by
Aston William
Home Financials for this Owner
Home Financials are based on the most recent Mortgage that was taken out on this home.
Original Mortgage
$17,089
Interest Rate
5.64%
Purchase Details
Closed on
Dec 15, 1999
Sold by
Cantrell Bobby
Bought by
Doolin Steve
Purchase Details
Closed on
Apr 15, 1997
Sold by
Skiles James C
Bought by
Skiles Tammy
Purchase Details
Closed on
Jan 1, 1985
Bought by
Skiles James C and Skiles Sandra A
Purchase Details
Closed on
Nov 19, 1942
Create a Home Valuation Report for This Property
The Home Valuation Report is an in-depth analysis detailing your home's value as well as a comparison with similar homes in the area
Home Values in the Area
Average Home Value in this Area
Purchase History
| Date | Buyer | Sale Price | Title Company |
|---|---|---|---|
| C & C Investments Gp | $45,000 | United Title | |
| Osler Dominique | -- | None Listed On Document | |
| Anthony Osler | $1,000 | -- | |
| Aston William | -- | -- | |
| Aston William | $25,000 | -- | |
| Doolin Steve | $121,699 | -- | |
| Skiles Tammy | -- | -- | |
| Skiles James C | $8,000 | -- | |
| -- | -- | -- |
Source: Public Records
Mortgage History
| Date | Status | Borrower | Loan Amount |
|---|---|---|---|
| Previous Owner | Not Available | $17,089 |
Source: Public Records
Tax History Compared to Growth
Tax History
| Year | Tax Paid | Tax Assessment Tax Assessment Total Assessment is a certain percentage of the fair market value that is determined by local assessors to be the total taxable value of land and additions on the property. | Land | Improvement |
|---|---|---|---|---|
| 2024 | $523 | $19,320 | $3,200 | $16,120 |
| 2023 | $115 | $10,440 | $1,400 | $9,040 |
| 2022 | $108 | $10,440 | $1,400 | $9,040 |
| 2021 | $108 | $10,440 | $1,400 | $9,040 |
| 2020 | $393 | $10,440 | $1,400 | $9,040 |
| 2019 | $393 | $10,440 | $1,400 | $9,040 |
| 2018 | $377 | $9,280 | $1,400 | $7,880 |
| 2017 | $372 | $9,280 | $1,400 | $7,880 |
| 2016 | $418 | $10,440 | $1,400 | $9,040 |
| 2015 | $415 | $10,440 | $1,400 | $9,040 |
| 2014 | -- | $10,440 | $1,400 | $9,040 |
Source: Public Records
Map
Nearby Homes
- 1907 E Mitchell St
- 700 N 18th Ave
- 0 +-6 Acres Gadsden Todd Levee Unit 241321
- 811 N 24th Ave
- 1635 Osborne St
- 2425 St Mary Dr
- 2508 Vine St
- 1509 Vine St
- 405 N 16th Ave
- 2107 Campbell St
- 1325 N 17th Ave
- 1416 N 18th Ave
- 112 S 17th Ave
- 1438 N 19th Ave
- 1338 Dungan St
- 171 N 28th Ave
- 0 Calhoun Etheridge & Rr Unit 246886
- 2900 E Mitchell St
- 700 N 29th Ave
- 2162 Dodson St
- 701 N 20th Ave
- 715 N 20th Ave
- 702 N 19th Ave
- 705 N 20th Ave
- 617 N 20th Ave
- 714 N 20th Ave
- 708 N 19th Ave
- 613 N 20th Ave
- 614 N 19th Ave Unit 616
- 716 N 20th Ave
- 712 N 19th Ave
- 614 N 20th Ave
- 609 N 20th Ave
- 723 N 20th Ave
- 716 N 19th Ave
- 705 N 21st Ave Unit 707
- 715 N 21st Ave
- 604 N 19th Ave
- 615 N 21st Ave
- 727 N 20th Ave