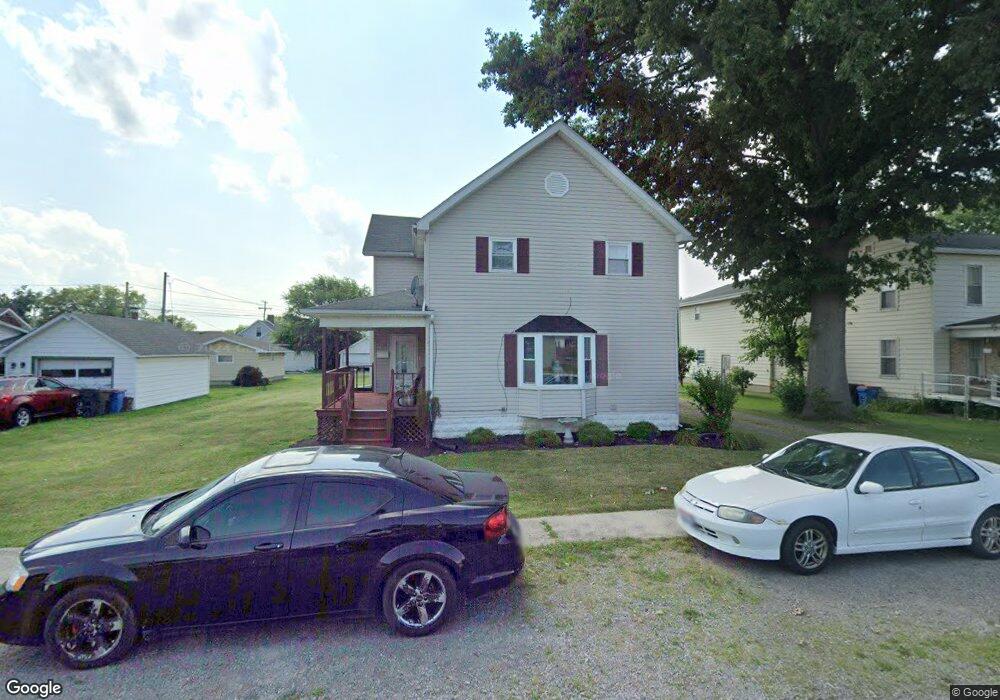
709 N Washington St Delphos, OH 45833
Estimated Value: $115,000 - $161,147
5
Beds
1
Bath
2,004
Sq Ft
$73/Sq Ft
Est. Value
About This Home
This home is located at 709 N Washington St, Delphos, OH 45833 and is currently estimated at $146,037, approximately $72 per square foot. 709 N Washington St is a home located in Allen County with nearby schools including Delphos St. John's High School and Delphos St. John's Elementary School.
Ownership History
Date
Name
Owned For
Owner Type
Purchase Details
Closed on
Dec 6, 2013
Sold by
Beat Robert D
Bought by
Beat Robert D and The Robert D Beat Revocable Living Trust
Current Estimated Value
Purchase Details
Closed on
Dec 5, 2012
Sold by
Beat William R
Bought by
Beat Robert D
Purchase Details
Closed on
Feb 3, 2009
Sold by
Secretary Of Housing & Urban Development
Bought by
Beat William R and Beat Robert D
Purchase Details
Closed on
Jun 3, 2008
Sold by
Grothjan Robert A and Grothjan Danille C
Bought by
Hud
Purchase Details
Closed on
Feb 22, 2002
Sold by
Hesseling Kevin C
Bought by
Grothjan Robert A and Grothjan Danielle C
Home Financials for this Owner
Home Financials are based on the most recent Mortgage that was taken out on this home.
Original Mortgage
$72,856
Interest Rate
7.14%
Mortgage Type
FHA
Purchase Details
Closed on
May 31, 1990
Bought by
Hesseling Kevin C
Create a Home Valuation Report for This Property
The Home Valuation Report is an in-depth analysis detailing your home's value as well as a comparison with similar homes in the area
Home Values in the Area
Average Home Value in this Area
Purchase History
| Date | Buyer | Sale Price | Title Company |
|---|---|---|---|
| Beat Robert D | -- | None Available | |
| Beat Robert D | -- | None Available | |
| Beat William R | $34,000 | Lakeside Title & Escrow Agen | |
| Hud | $58,000 | None Available | |
| Grothjan Robert A | $74,000 | -- | |
| Hesseling Kevin C | $35,500 | -- |
Source: Public Records
Mortgage History
| Date | Status | Borrower | Loan Amount |
|---|---|---|---|
| Previous Owner | Grothjan Robert A | $72,856 |
Source: Public Records
Tax History Compared to Growth
Tax History
| Year | Tax Paid | Tax Assessment Tax Assessment Total Assessment is a certain percentage of the fair market value that is determined by local assessors to be the total taxable value of land and additions on the property. | Land | Improvement |
|---|---|---|---|---|
| 2024 | $1,270 | $39,940 | $6,510 | $33,430 |
| 2023 | $1,003 | $29,830 | $4,870 | $24,960 |
| 2022 | $1,019 | $29,580 | $4,870 | $24,710 |
| 2021 | $1,026 | $29,580 | $4,870 | $24,710 |
| 2020 | $911 | $27,650 | $5,110 | $22,540 |
| 2019 | $911 | $27,650 | $5,110 | $22,540 |
| 2018 | $925 | $27,650 | $5,110 | $22,540 |
| 2017 | $857 | $25,590 | $5,110 | $20,480 |
| 2016 | $871 | $25,590 | $5,110 | $20,480 |
| 2015 | $859 | $25,590 | $5,110 | $20,480 |
| 2014 | $812 | $23,910 | $4,900 | $19,010 |
| 2013 | $818 | $23,910 | $4,900 | $19,010 |
Source: Public Records
Map
Nearby Homes