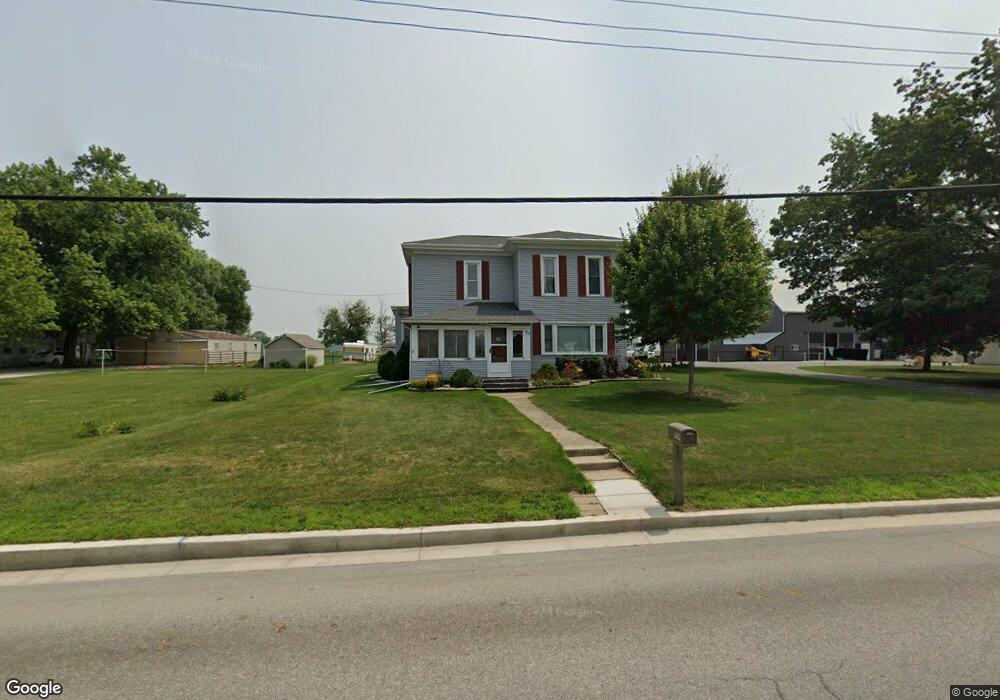
709 S Main St Topeka, IN 46571
Estimated Value: $244,000 - $289,000
4
Beds
3
Baths
2,488
Sq Ft
$107/Sq Ft
Est. Value
About This Home
This home is located at 709 S Main St, Topeka, IN 46571 and is currently estimated at $265,844, approximately $106 per square foot. 709 S Main St is a home located in LaGrange County with nearby schools including Topeka Elementary School, Westview Elementary School, and Westview Junior/Senior High School.
Ownership History
Date
Name
Owned For
Owner Type
Purchase Details
Closed on
Aug 6, 2025
Sold by
Ayres Katelyn R and Ayres Christopher S
Bought by
Ayres Katelyn R and Burr Jeramiah Paul
Current Estimated Value
Home Financials for this Owner
Home Financials are based on the most recent Mortgage that was taken out on this home.
Original Mortgage
$230,743
Outstanding Balance
$230,545
Interest Rate
6.77%
Mortgage Type
FHA
Estimated Equity
$35,299
Create a Home Valuation Report for This Property
The Home Valuation Report is an in-depth analysis detailing your home's value as well as a comparison with similar homes in the area
Home Values in the Area
Average Home Value in this Area
Purchase History
| Date | Buyer | Sale Price | Title Company |
|---|---|---|---|
| Ayres Katelyn R | -- | Meridian Title | |
| Ayres Katelyn R | -- | First American Title |
Source: Public Records
Mortgage History
| Date | Status | Borrower | Loan Amount |
|---|---|---|---|
| Open | Ayres Katelyn R | $230,743 |
Source: Public Records
Tax History Compared to Growth
Tax History
| Year | Tax Paid | Tax Assessment Tax Assessment Total Assessment is a certain percentage of the fair market value that is determined by local assessors to be the total taxable value of land and additions on the property. | Land | Improvement |
|---|---|---|---|---|
| 2024 | $1,984 | $199,000 | $17,600 | $181,400 |
| 2023 | $1,650 | $188,100 | $16,000 | $172,100 |
| 2022 | $1,719 | $171,500 | $14,300 | $157,200 |
| 2021 | $1,683 | $157,300 | $13,600 | $143,700 |
| 2020 | $1,679 | $153,600 | $13,600 | $140,000 |
| 2019 | $1,623 | $151,100 | $13,600 | $137,500 |
| 2018 | $1,338 | $131,100 | $13,600 | $117,500 |
| 2017 | $1,428 | $133,100 | $13,600 | $119,500 |
| 2016 | $1,276 | $129,900 | $13,600 | $116,300 |
| 2014 | $803 | $100,600 | $15,600 | $85,000 |
| 2013 | $803 | $101,500 | $15,600 | $85,900 |
Source: Public Records
Map
Nearby Homes