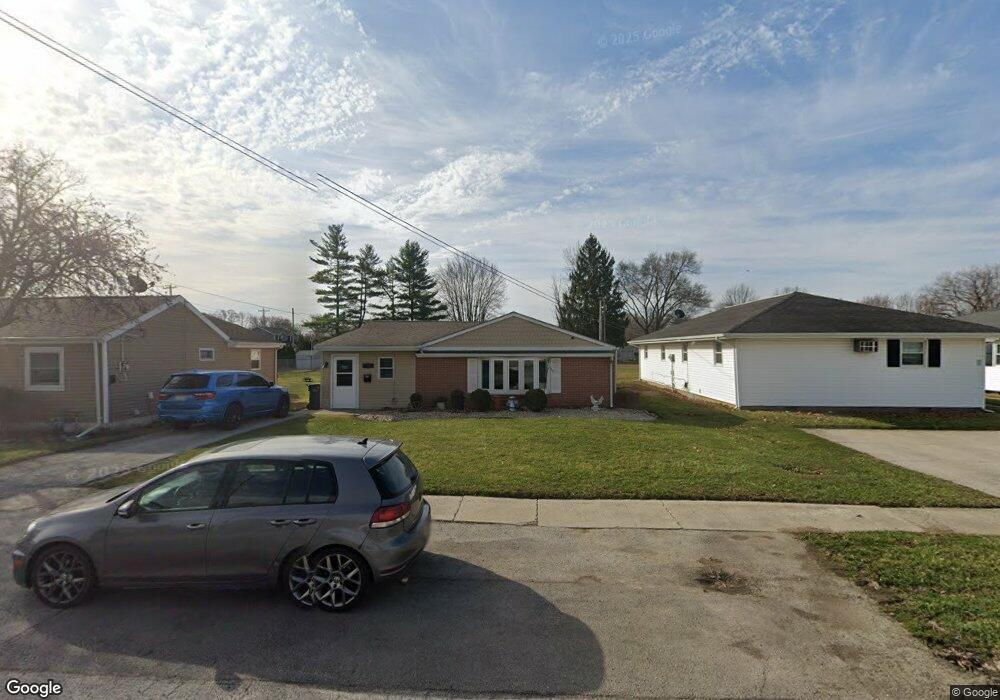
709 Swing Ave Findlay, OH 45840
Estimated Value: $177,620 - $188,000
3
Beds
2
Baths
1,590
Sq Ft
$116/Sq Ft
Est. Value
About This Home
This home is located at 709 Swing Ave, Findlay, OH 45840 and is currently estimated at $185,155, approximately $116 per square foot. 709 Swing Ave is a home located in Hancock County with nearby schools including Northview Elementary School, Bigelow Hill Elementary School, and Glenwood Middle School.
Ownership History
Date
Name
Owned For
Owner Type
Purchase Details
Closed on
Dec 3, 2007
Sold by
Pardo Debra
Bought by
Comfort Zone Enterprises Inc
Current Estimated Value
Purchase Details
Closed on
Sep 29, 2005
Sold by
Molik Linda L
Bought by
Pardo Debra
Home Financials for this Owner
Home Financials are based on the most recent Mortgage that was taken out on this home.
Original Mortgage
$85,500
Interest Rate
10.12%
Mortgage Type
Fannie Mae Freddie Mac
Purchase Details
Closed on
Sep 26, 2000
Sold by
Ammons Darrin L
Bought by
Molik Linda L
Home Financials for this Owner
Home Financials are based on the most recent Mortgage that was taken out on this home.
Original Mortgage
$58,410
Interest Rate
8.05%
Mortgage Type
New Conventional
Purchase Details
Closed on
Oct 13, 1992
Bought by
Ammons Darrin L
Create a Home Valuation Report for This Property
The Home Valuation Report is an in-depth analysis detailing your home's value as well as a comparison with similar homes in the area
Home Values in the Area
Average Home Value in this Area
Purchase History
| Date | Buyer | Sale Price | Title Company |
|---|---|---|---|
| Comfort Zone Enterprises Inc | $32,000 | None Available | |
| Pardo Debra | $90,000 | Mid Am Title Agency | |
| Molik Linda L | $64,900 | -- | |
| Ammons Darrin L | $43,500 | -- |
Source: Public Records
Mortgage History
| Date | Status | Borrower | Loan Amount |
|---|---|---|---|
| Previous Owner | Pardo Debra | $85,500 | |
| Previous Owner | Molik Linda L | $58,410 |
Source: Public Records
Tax History
| Year | Tax Paid | Tax Assessment Tax Assessment Total Assessment is a certain percentage of the fair market value that is determined by local assessors to be the total taxable value of land and additions on the property. | Land | Improvement |
|---|---|---|---|---|
| 2024 | $1,848 | $50,710 | $5,600 | $45,110 |
| 2023 | $1,852 | $50,710 | $5,600 | $45,110 |
| 2022 | $1,845 | $50,710 | $5,600 | $45,110 |
| 2021 | $1,912 | $45,770 | $5,600 | $40,170 |
| 2020 | $1,912 | $45,770 | $5,600 | $40,170 |
| 2019 | $1,874 | $45,770 | $5,600 | $40,170 |
| 2018 | $1,504 | $33,700 | $4,740 | $28,960 |
| 2017 | $1,505 | $33,700 | $4,740 | $28,960 |
| 2016 | $1,491 | $33,700 | $4,740 | $28,960 |
| 2015 | $1,644 | $36,560 | $4,740 | $31,820 |
| 2014 | $1,644 | $36,560 | $4,740 | $31,820 |
| 2012 | $1,656 | $36,560 | $4,740 | $31,820 |
Source: Public Records
Map
Nearby Homes
- 705 Swing Ave
- 719 Davis St
- 605 Davis St
- 421 Clifton Ave
- 243 Monroe Ave
- 405 Clifton Ave
- 528 Rector Ave
- 341 Defiance Ave
- 140 Monroe Ave
- 146 Clifton Ave
- 724 Edith Ave
- 701 W Melrose Ave
- 217 Prentiss Ave
- 925 W Melrose Ave
- 239 Edith Ave
- 206 Midland Ave
- 315 W Melrose Ave
- 0 County Road 223
- 207 Ash Ave
- 2318 Anna St
Your Personal Tour Guide
Ask me questions while you tour the home.