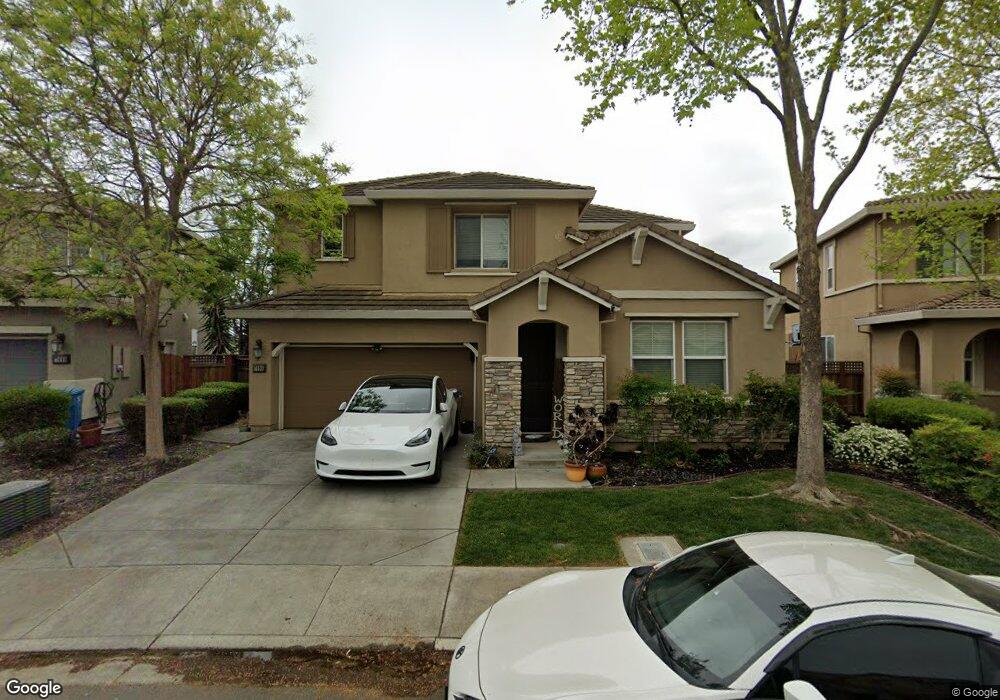
7095 Stonebrooke Dr Vallejo, CA 94591
Somerset Highlands NeighborhoodEstimated Value: $767,459 - $830,000
4
Beds
4
Baths
2,560
Sq Ft
$310/Sq Ft
Est. Value
About This Home
This home is located at 7095 Stonebrooke Dr, Vallejo, CA 94591 and is currently estimated at $792,865, approximately $309 per square foot. 7095 Stonebrooke Dr is a home located in Solano County with nearby schools including Joe Henderson Elementary School, Benicia Middle School, and Benicia High School.
Ownership History
Date
Name
Owned For
Owner Type
Purchase Details
Closed on
Apr 4, 2024
Sold by
Leoncio Dojie
Bought by
Dojie Leoncio Revocable Trust and Leoncio
Current Estimated Value
Purchase Details
Closed on
Sep 30, 2016
Sold by
Smith Ron C and Smith Trina T
Bought by
Leoncio Dojie
Home Financials for this Owner
Home Financials are based on the most recent Mortgage that was taken out on this home.
Original Mortgage
$412,000
Interest Rate
3.43%
Mortgage Type
New Conventional
Purchase Details
Closed on
Apr 28, 2011
Sold by
K Hovnanian At Waterstone Llc
Bought by
Smith Ron C and Smith Trina T
Home Financials for this Owner
Home Financials are based on the most recent Mortgage that was taken out on this home.
Original Mortgage
$409,353
Interest Rate
4.75%
Mortgage Type
FHA
Purchase Details
Closed on
Mar 9, 2010
Sold by
Braddock & Logan Group Ii Lp
Bought by
K Hovnanian Homes At Waterstone Llc
Create a Home Valuation Report for This Property
The Home Valuation Report is an in-depth analysis detailing your home's value as well as a comparison with similar homes in the area
Home Values in the Area
Average Home Value in this Area
Purchase History
| Date | Buyer | Sale Price | Title Company |
|---|---|---|---|
| Dojie Leoncio Revocable Trust | -- | None Listed On Document | |
| Leoncio Dojie | $515,000 | Placer Title Company | |
| Smith Ron C | $420,000 | First American Title Company | |
| K Hovnanian Homes At Waterstone Llc | -- | First American Title Company |
Source: Public Records
Mortgage History
| Date | Status | Borrower | Loan Amount |
|---|---|---|---|
| Previous Owner | Leoncio Dojie | $412,000 | |
| Previous Owner | Smith Ron C | $409,353 |
Source: Public Records
Tax History
| Year | Tax Paid | Tax Assessment Tax Assessment Total Assessment is a certain percentage of the fair market value that is determined by local assessors to be the total taxable value of land and additions on the property. | Land | Improvement |
|---|---|---|---|---|
| 2025 | $8,160 | $597,695 | $127,661 | $470,034 |
| 2024 | $8,160 | $585,976 | $125,158 | $460,818 |
| 2023 | $7,780 | $574,487 | $122,704 | $451,783 |
| 2022 | $7,712 | $563,224 | $120,299 | $442,925 |
| 2021 | $7,554 | $552,182 | $117,941 | $434,241 |
| 2020 | $7,622 | $546,521 | $116,732 | $429,789 |
| 2019 | $7,436 | $535,806 | $114,444 | $421,362 |
| 2018 | $7,009 | $525,300 | $112,200 | $413,100 |
| 2017 | $6,736 | $515,000 | $110,000 | $405,000 |
| 2016 | $5,598 | $454,548 | $108,225 | $346,323 |
| 2015 | $5,530 | $447,721 | $106,600 | $341,121 |
| 2014 | $5,458 | $438,951 | $104,512 | $334,439 |
Source: Public Records
Map
Nearby Homes
- 1466 Granada St
- 8601 Rockaway Dr
- 8707 Aquamarine Dr
- 8620 Rockaway Dr
- 479 Aragon St
- 8632 Rockaway Dr
- 111 Elgin Ct
- 185 Lexington Dr
- 112 Aragon Ct
- 118 Hydrangea Ct
- 108 Sunnyglen Dr
- 116 Greeves St
- 128 Newcastle Dr
- 709 Pope Dr
- 150 Yorkshire Ct
- 902 Bolton Cir
- 223 Toledo Ct
- 235 Toledo Ct
- 236 Corkwood St
- 879 Oxford Way
- 7099 Stonebrooke Dr
- 7091 Stonebrooke Dr
- 7103 Stonebrooke Dr
- 7087 Stonebrooke Dr
- 7331 Abbey Dr
- 7088 Stonebrooke Dr
- 7083 Stonebrooke Dr
- 7327 Abbey Dr
- 7107 Stonebrooke Dr
- 7111 Stonebrooke Dr
- 7078 Stonebrooke Dr
- 7079 Stonebrooke Dr
- 7106 Stonebrooke Dr
- 7323 Abbey Dr
- 7074 Stonebrooke Dr
- 7328 Abbey Dr
- 7110 Stonebrooke Dr
- 7075 Stonebrooke Dr
- 7115 Stonebrooke Dr
- 7319 Abbey Dr
Your Personal Tour Guide
Ask me questions while you tour the home.