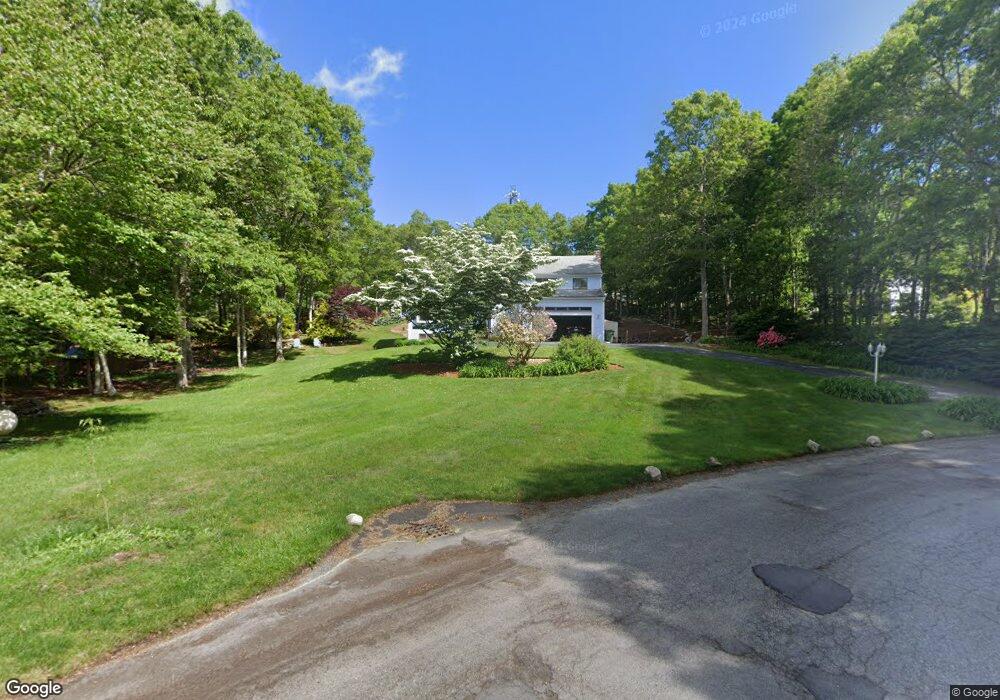
71 Allan Rd West Barnstable, MA 02668
West Barnstable NeighborhoodEstimated Value: $787,000 - $859,000
4
Beds
3
Baths
2,364
Sq Ft
$355/Sq Ft
Est. Value
About This Home
This home is located at 71 Allan Rd, West Barnstable, MA 02668 and is currently estimated at $838,144, approximately $354 per square foot. 71 Allan Rd is a home located in Barnstable County with nearby schools including Barnstable United Elementary School, West Barnstable Elementary School, and Barnstable Intermediate School.
Ownership History
Date
Name
Owned For
Owner Type
Purchase Details
Closed on
Jun 6, 2024
Sold by
Coombs Frank A and Coombs Helen A
Bought by
Coombs Ft and Coombs
Current Estimated Value
Home Financials for this Owner
Home Financials are based on the most recent Mortgage that was taken out on this home.
Original Mortgage
$100,000
Outstanding Balance
$98,724
Interest Rate
7.02%
Mortgage Type
Stand Alone Refi Refinance Of Original Loan
Estimated Equity
$739,420
Purchase Details
Closed on
Dec 11, 1992
Sold by
Greenbrier Homes Inc
Bought by
Coombs Frank A and Coombs Helen A
Home Financials for this Owner
Home Financials are based on the most recent Mortgage that was taken out on this home.
Original Mortgage
$90,000
Interest Rate
8.16%
Mortgage Type
Purchase Money Mortgage
Create a Home Valuation Report for This Property
The Home Valuation Report is an in-depth analysis detailing your home's value as well as a comparison with similar homes in the area
Home Values in the Area
Average Home Value in this Area
Purchase History
| Date | Buyer | Sale Price | Title Company |
|---|---|---|---|
| Coombs Ft | -- | None Available | |
| Coombs Ft | -- | None Available | |
| Coombs Frank A | $188,925 | -- | |
| Coombs Frank A | $188,925 | -- |
Source: Public Records
Mortgage History
| Date | Status | Borrower | Loan Amount |
|---|---|---|---|
| Open | Coombs Ft | $100,000 | |
| Closed | Coombs Ft | $100,000 | |
| Previous Owner | Coombs Frank A | $100,000 | |
| Previous Owner | Coombs Frank A | $40,000 | |
| Previous Owner | Coombs Frank A | $30,000 | |
| Previous Owner | Coombs Frank A | $90,000 |
Source: Public Records
Tax History
| Year | Tax Paid | Tax Assessment Tax Assessment Total Assessment is a certain percentage of the fair market value that is determined by local assessors to be the total taxable value of land and additions on the property. | Land | Improvement |
|---|---|---|---|---|
| 2025 | $6,296 | $778,200 | $178,200 | $600,000 |
| 2024 | $6,235 | $798,300 | $178,200 | $620,100 |
| 2023 | $5,421 | $650,000 | $162,200 | $487,800 |
| 2022 | $5,567 | $577,500 | $120,700 | $456,800 |
| 2021 | $5,419 | $516,600 | $120,700 | $395,900 |
| 2020 | $5,146 | $469,500 | $129,600 | $339,900 |
| 2019 | $4,674 | $414,400 | $129,600 | $284,800 |
| 2018 | $4,917 | $438,200 | $136,400 | $301,800 |
| 2017 | $4,602 | $427,700 | $136,400 | $291,300 |
| 2016 | $4,673 | $428,700 | $137,400 | $291,300 |
| 2015 | $4,465 | $411,500 | $131,600 | $279,900 |
Source: Public Records
Map
Nearby Homes
- 324 Patriot Way
- 29 Appaloosa Way
- 16 Morgan Way
- 89 Moco Rd
- 900 Old Stage Rd
- 74 Saddler Ln
- 52 Windlass Ln
- 66 Tern Ln
- 73 Tern Ln
- 253 Gleneagle Dr
- 37 Ansel Howland Rd
- 350 Plum St
- 367 Plum St
- 282 Parker Rd
- 38 White Oak Trail
- 172 Skunknet Rd
- 169 Cedric Rd
- 117 Elijah Childs Ln
- 1825 Main St
- 315 Prince Hinckley Rd
Your Personal Tour Guide
Ask me questions while you tour the home.